18 Cross-modal Integration
18.1 WNN graph construction
combined <- FindMultiModalNeighbors(combined ,
                                  reduction.list = list("rna.integration", "umap.atac"),
                                  dims.list = list(1:ncol(Embeddings(combined,"rna.integration")),
                                                   1:ncol(Embeddings(combined,"rna.integration"))),
                                  modality.weight.name = c("RNA.weight","ATAC.weight"),
                                  verbose = TRUE)


combined <- RunUMAP(combined,
                    nn.name        = "weighted.nn",
                    assay          = "RNA",
                    reduction.name = "integration.wnn",
                    reduction.key  = "WNN_")

resolution <- 2
combined   <- FindClusters(combined,
                           graph.name = "wsnn",
                           resolution = seq(0.1, resolution, 0.1))
18.2 WNN UMAP
DimPlot(combined, reduction = 'integration.wnn', group.by = "sample")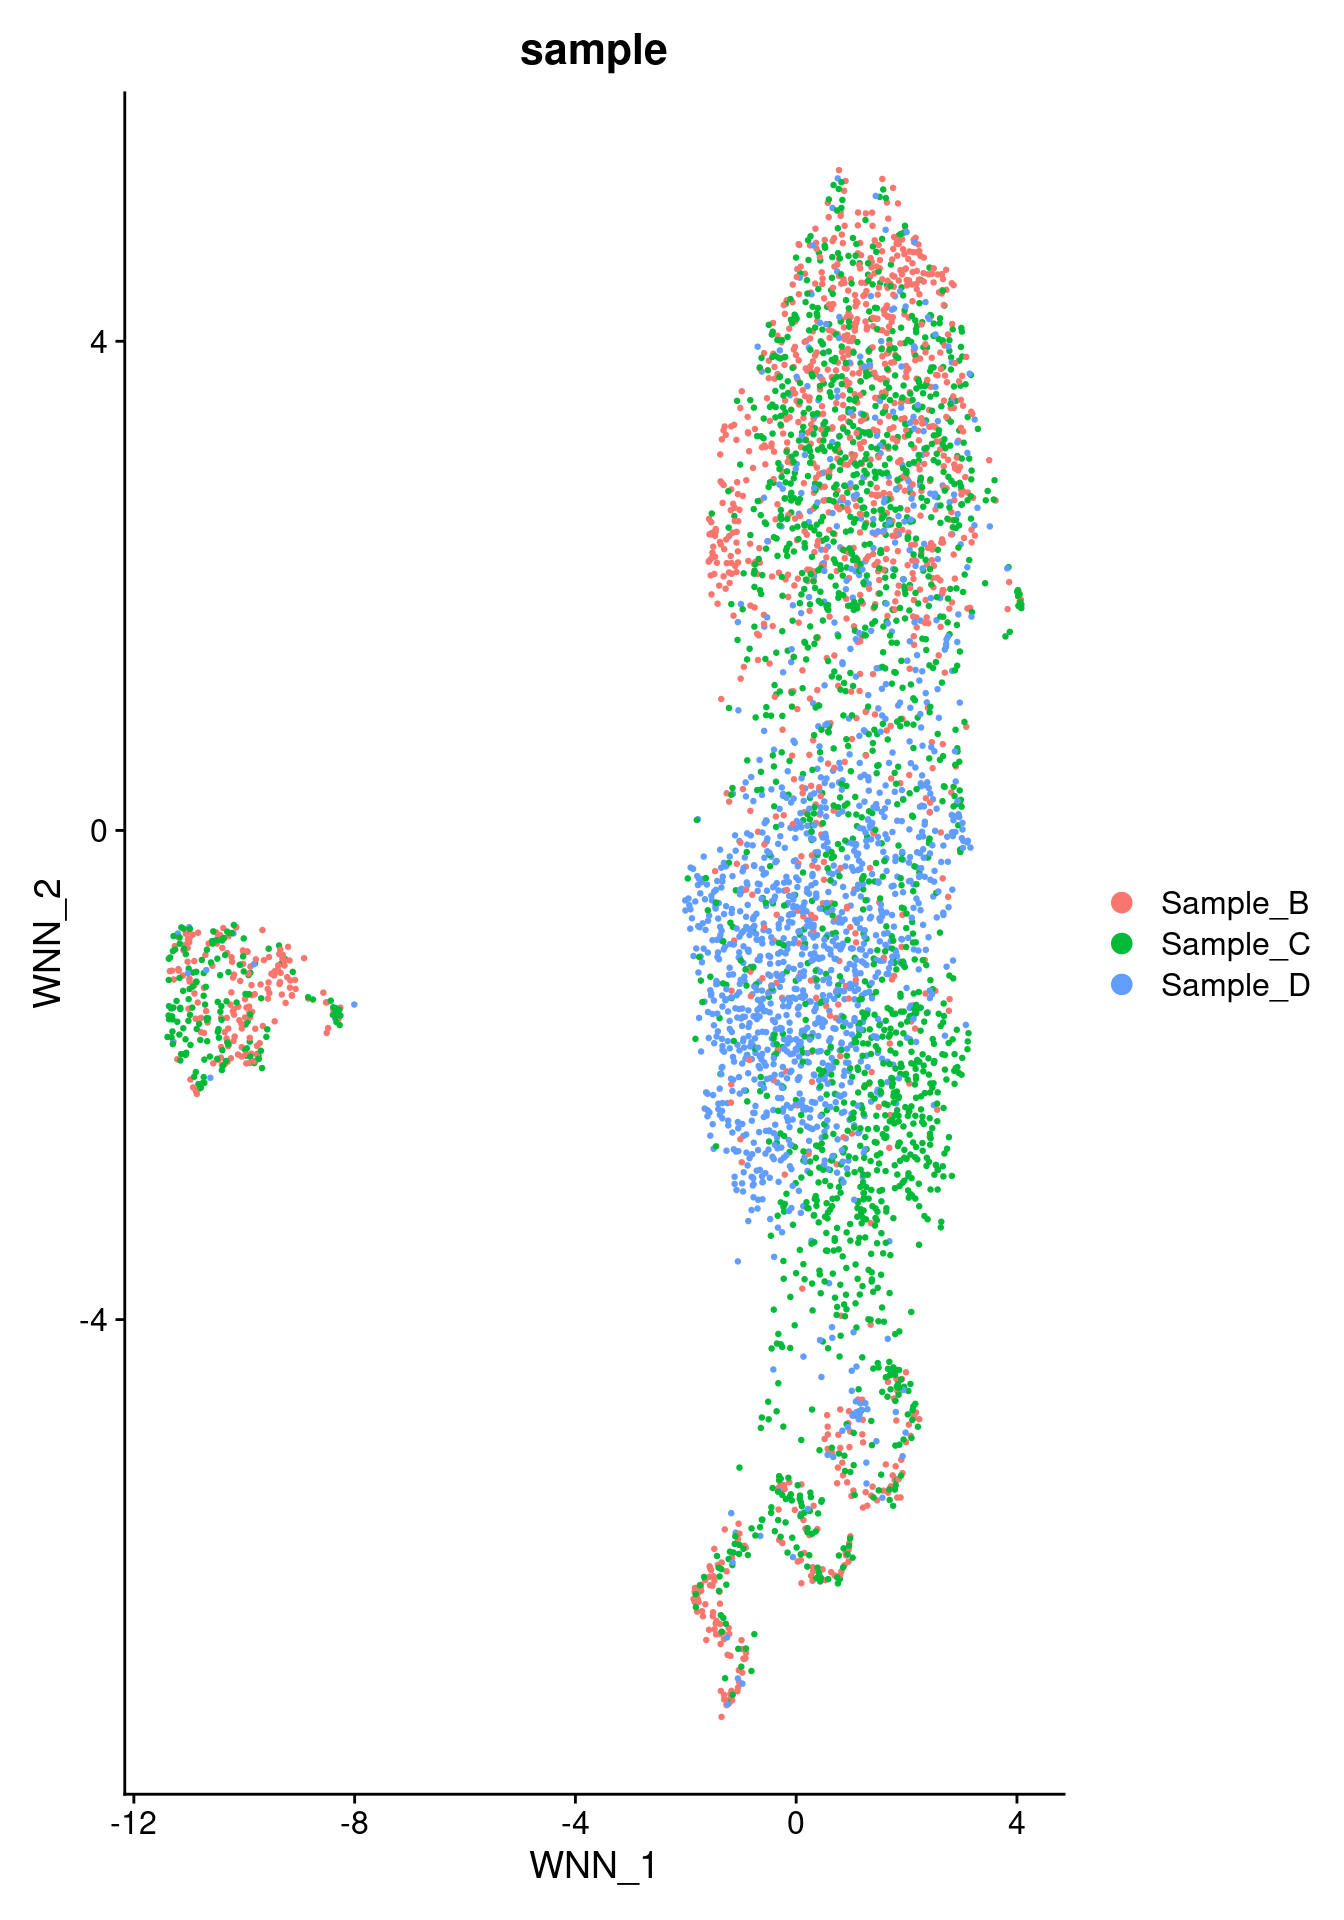
DimPlot(combined, reduction = 'integration.wnn', group.by = "sample_donor")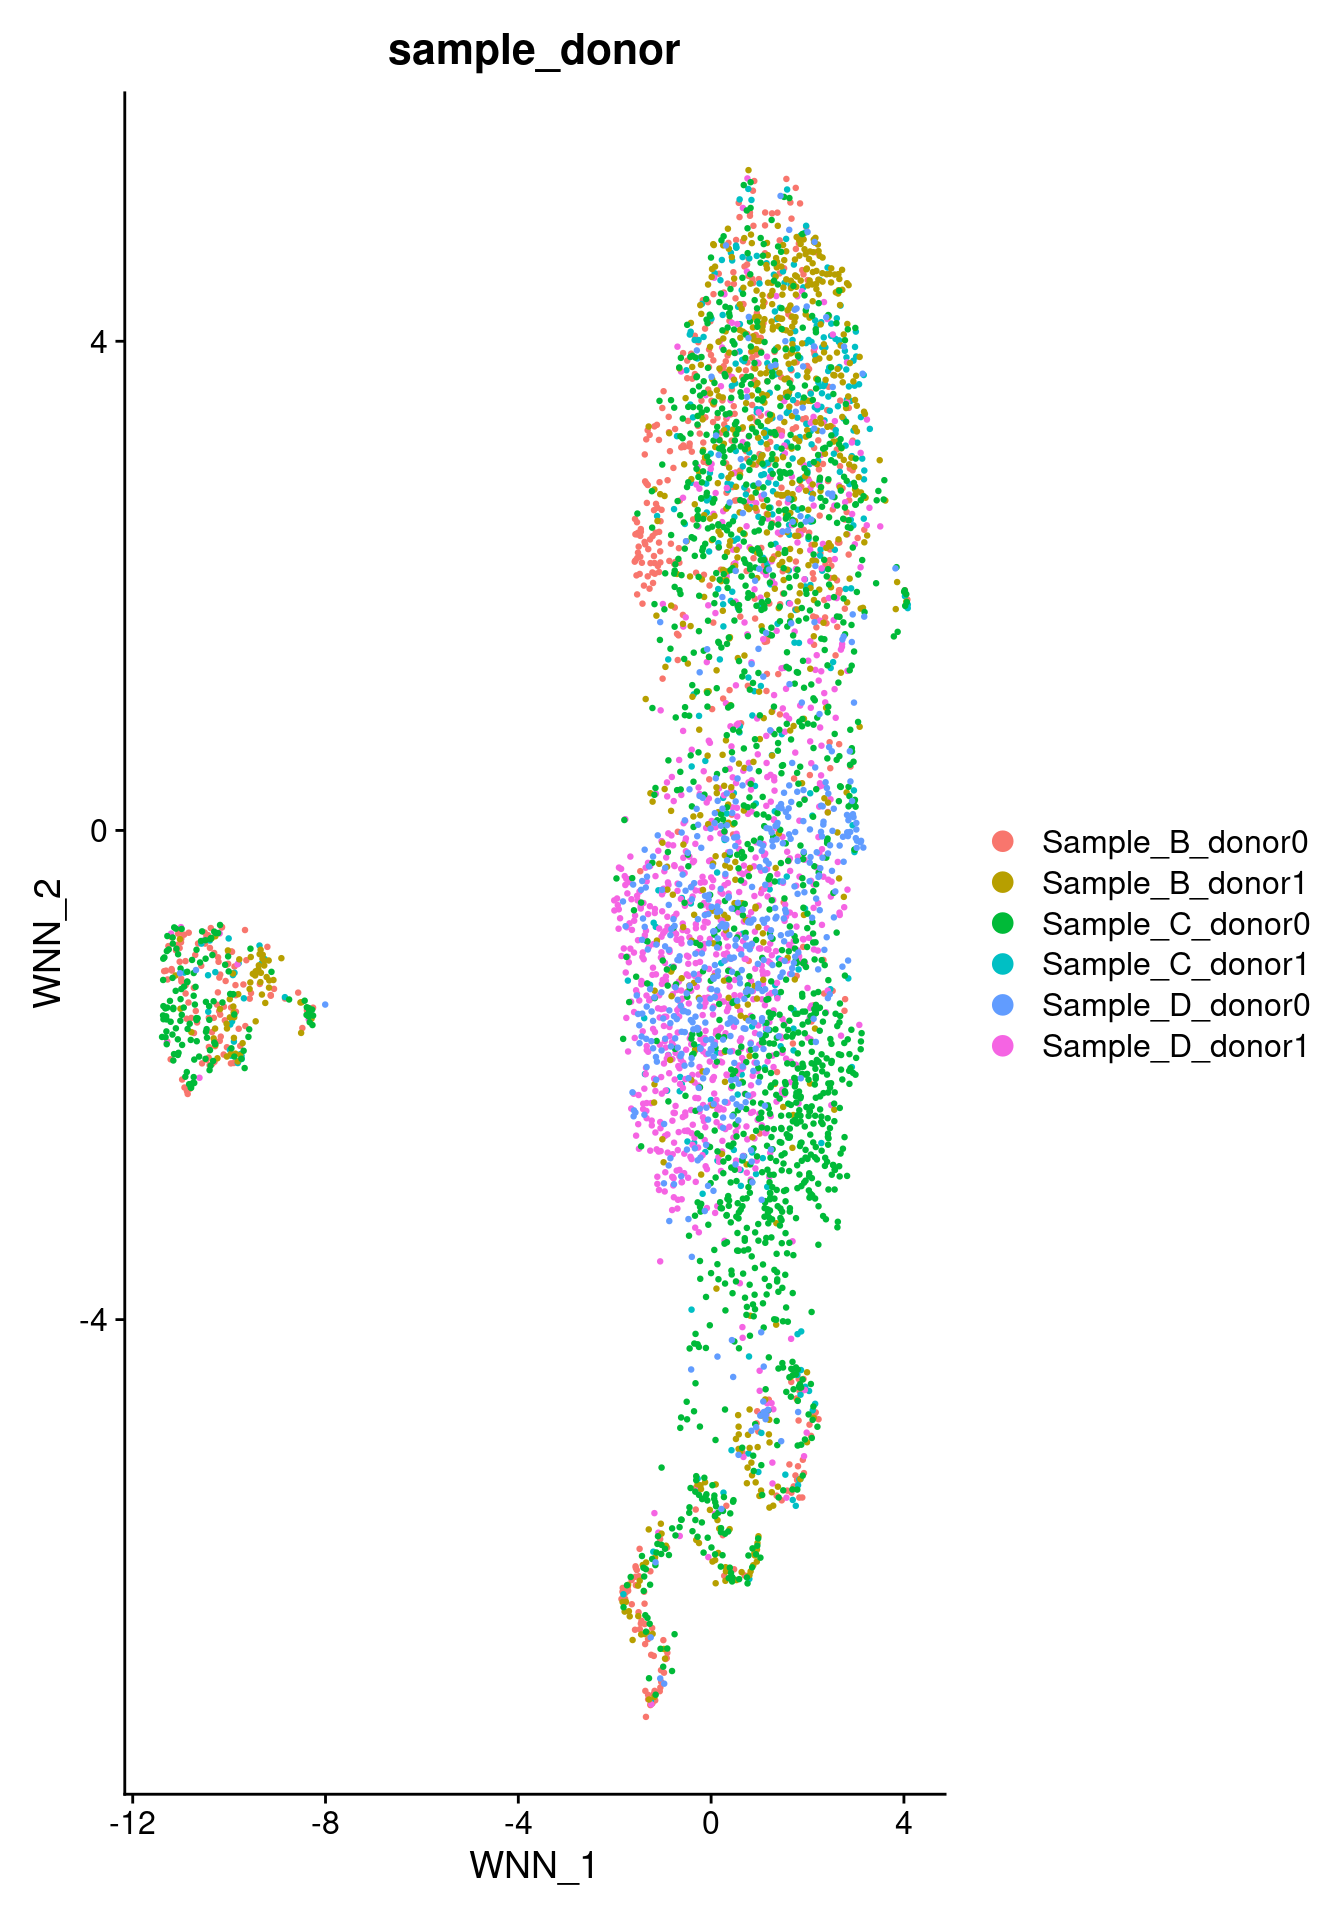
DimPlot(combined, reduction = 'integration.wnn', group.by = "individual_condition")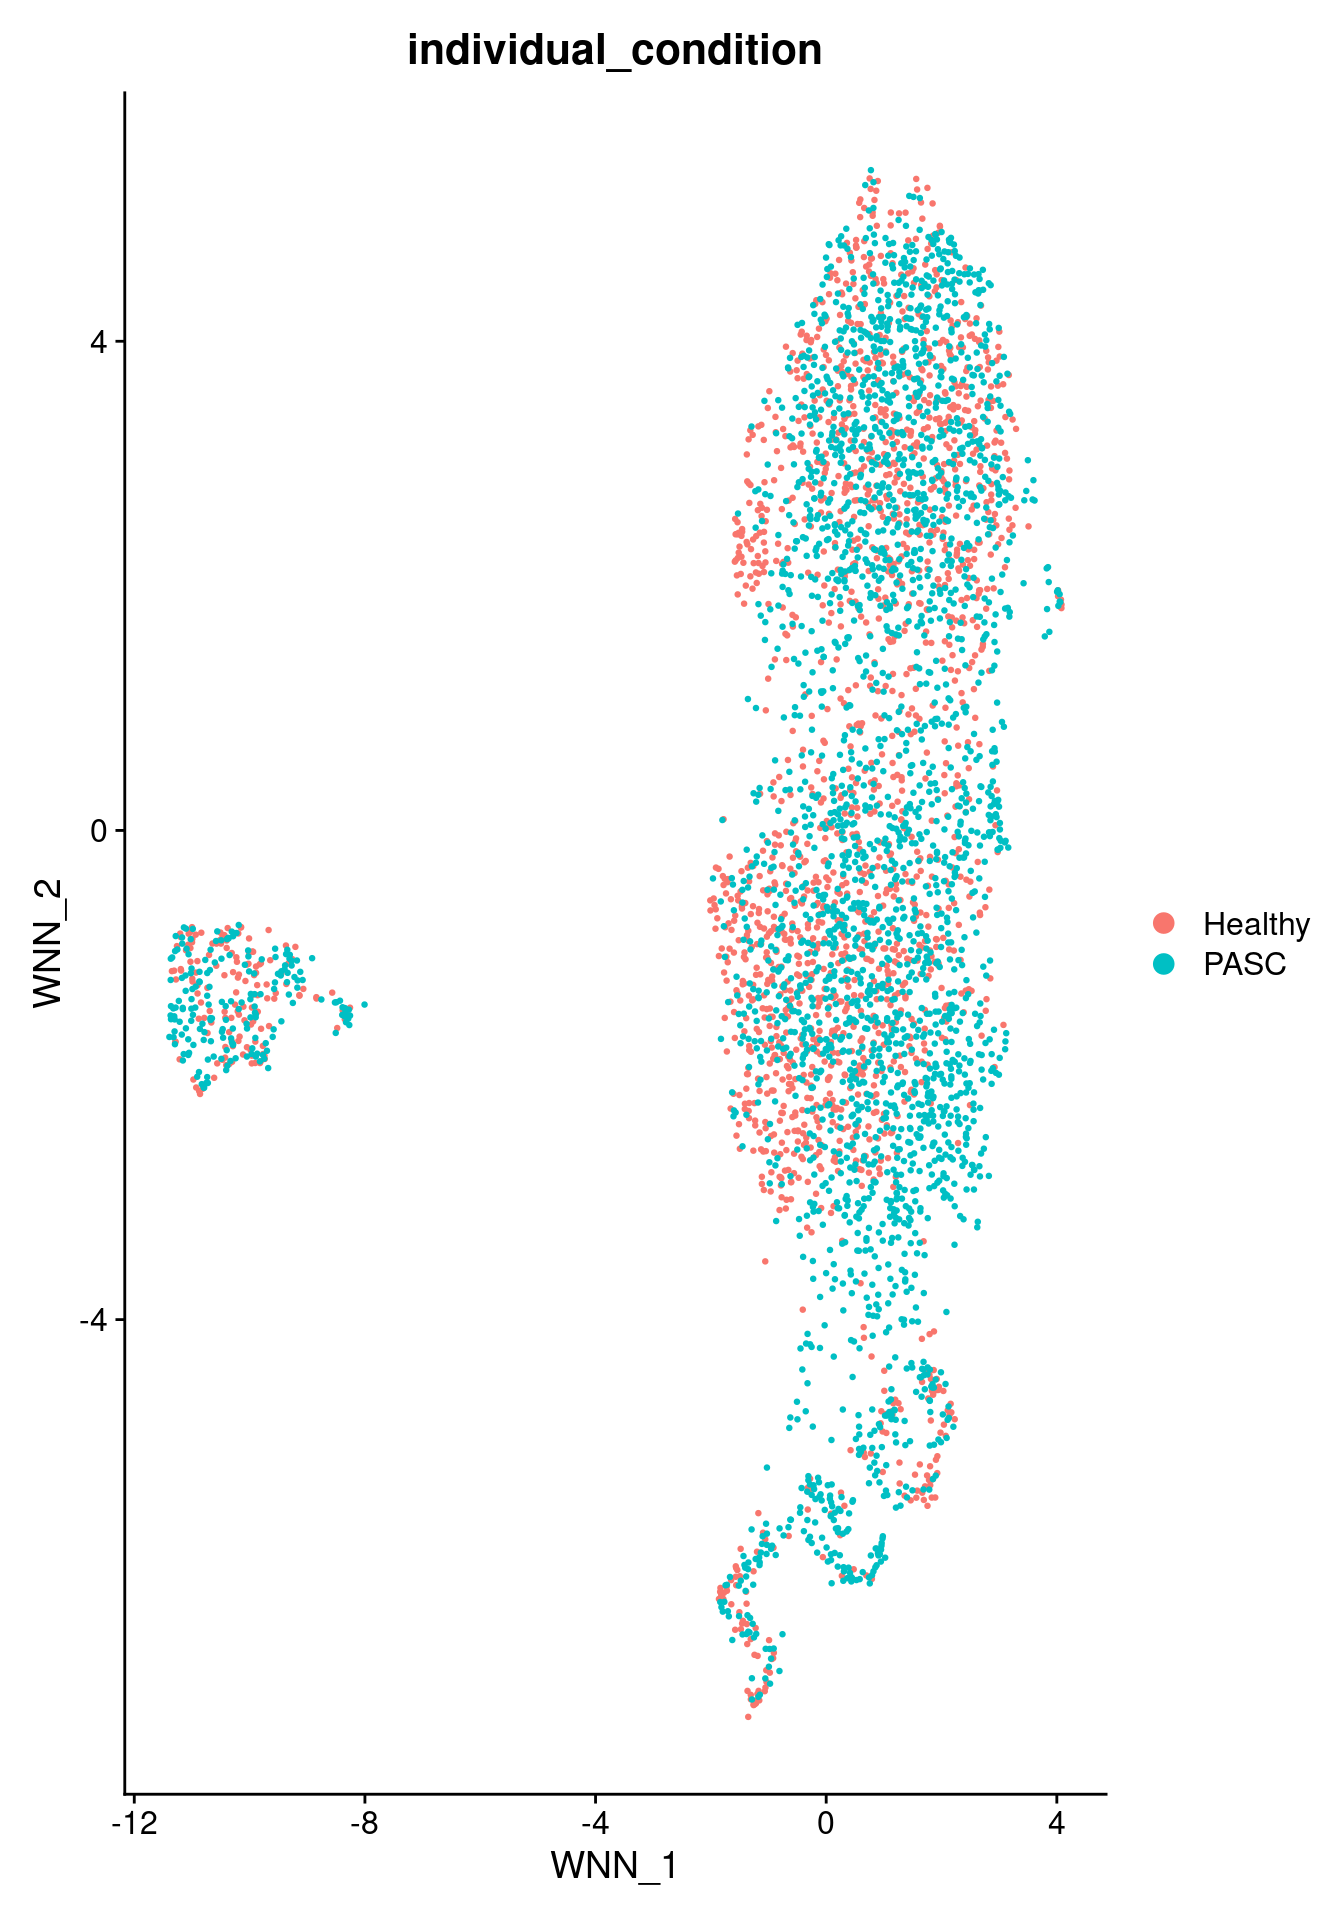
DimPlot(combined, reduction = 'integration.wnn', group.by = "SingleR.labels")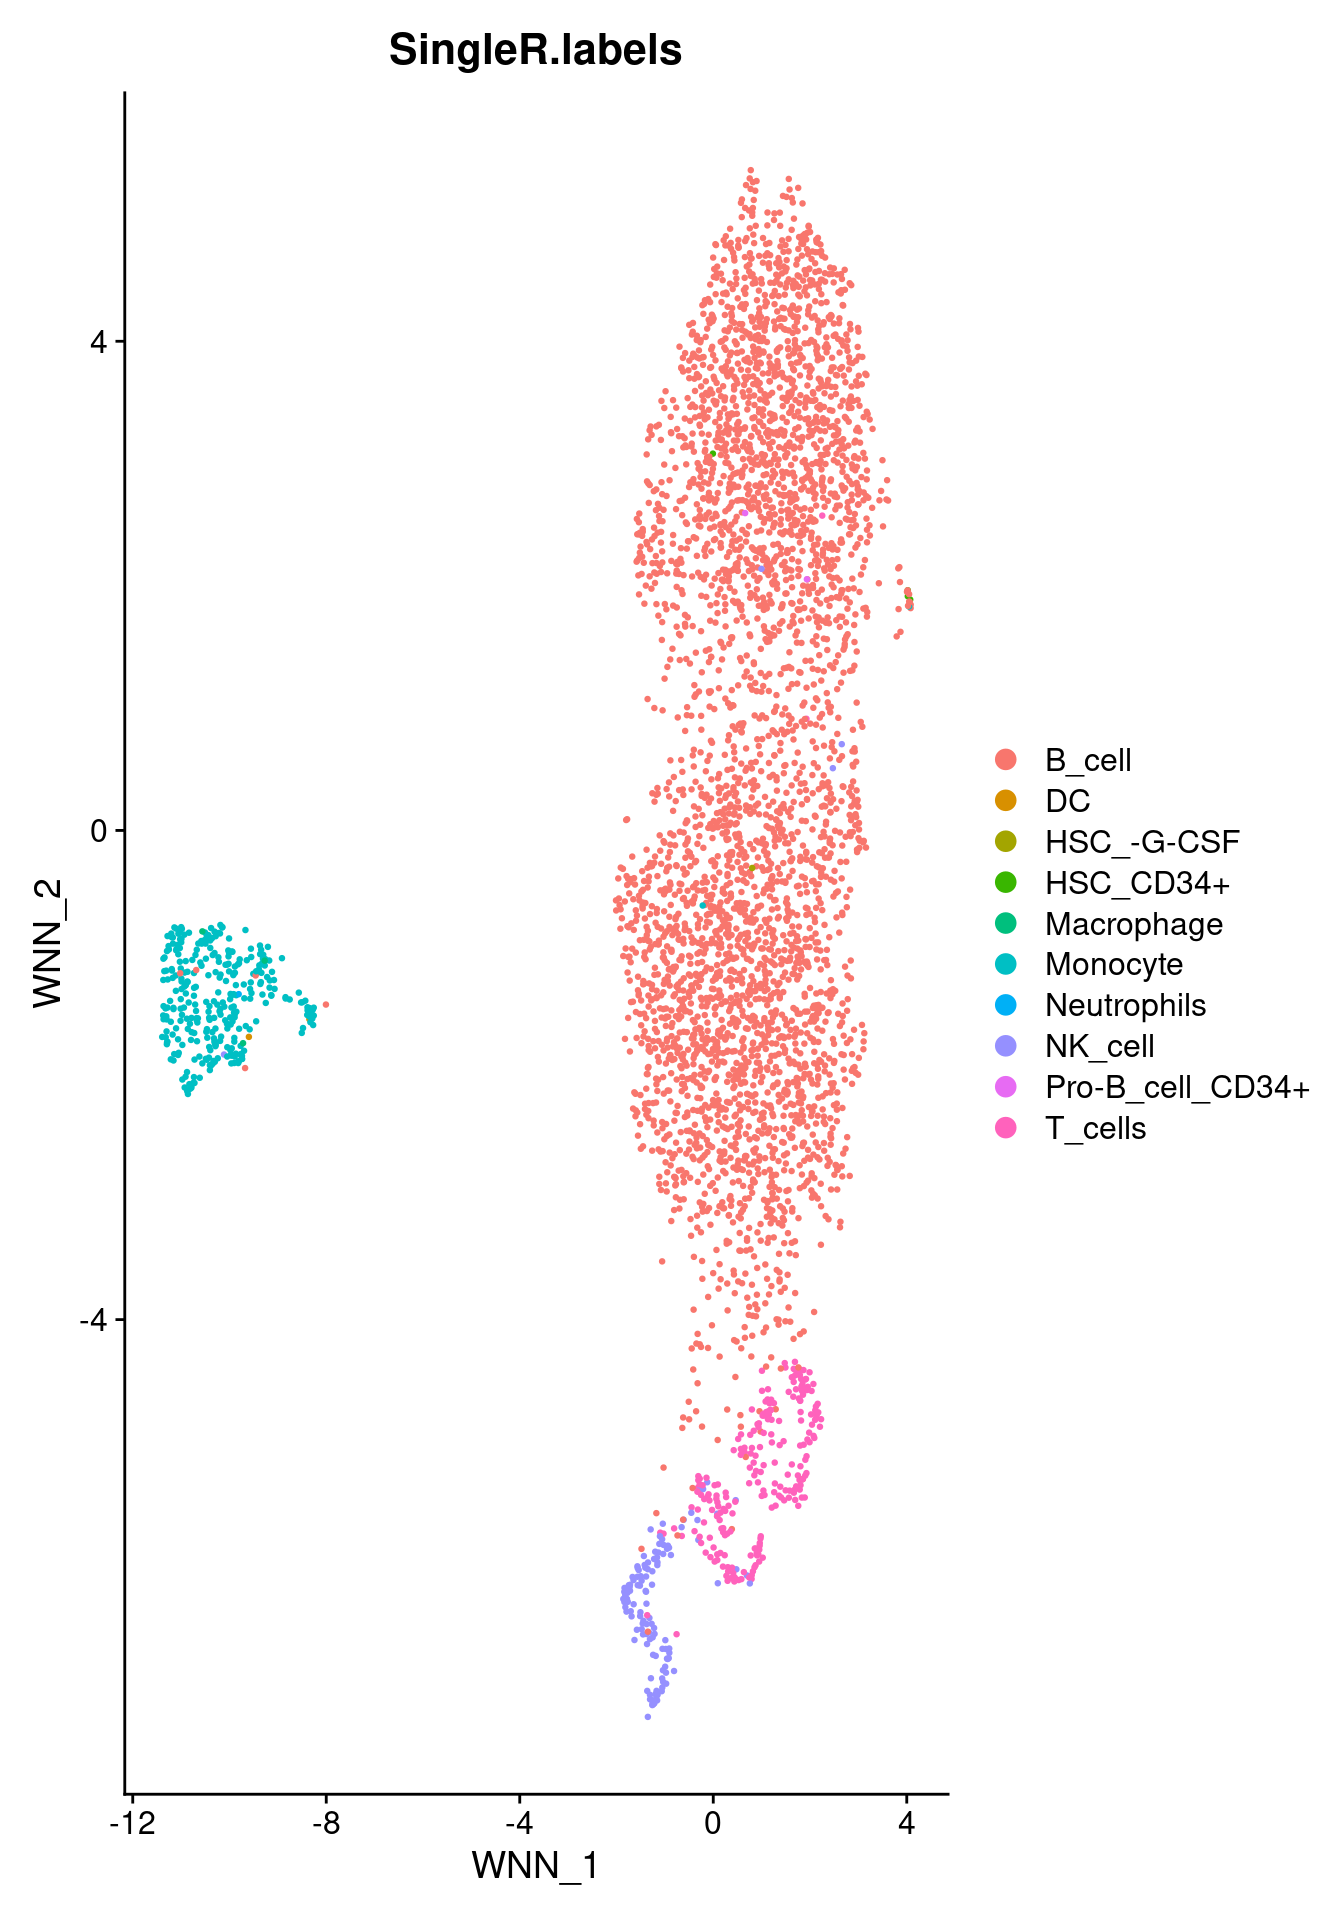
18.3 WNN UMAP — cell types split by condition
DimPlot(combined,
        reduction = 'integration.wnn',
        group.by  = "SingleR.labels",
        split.by  = "individual_condition")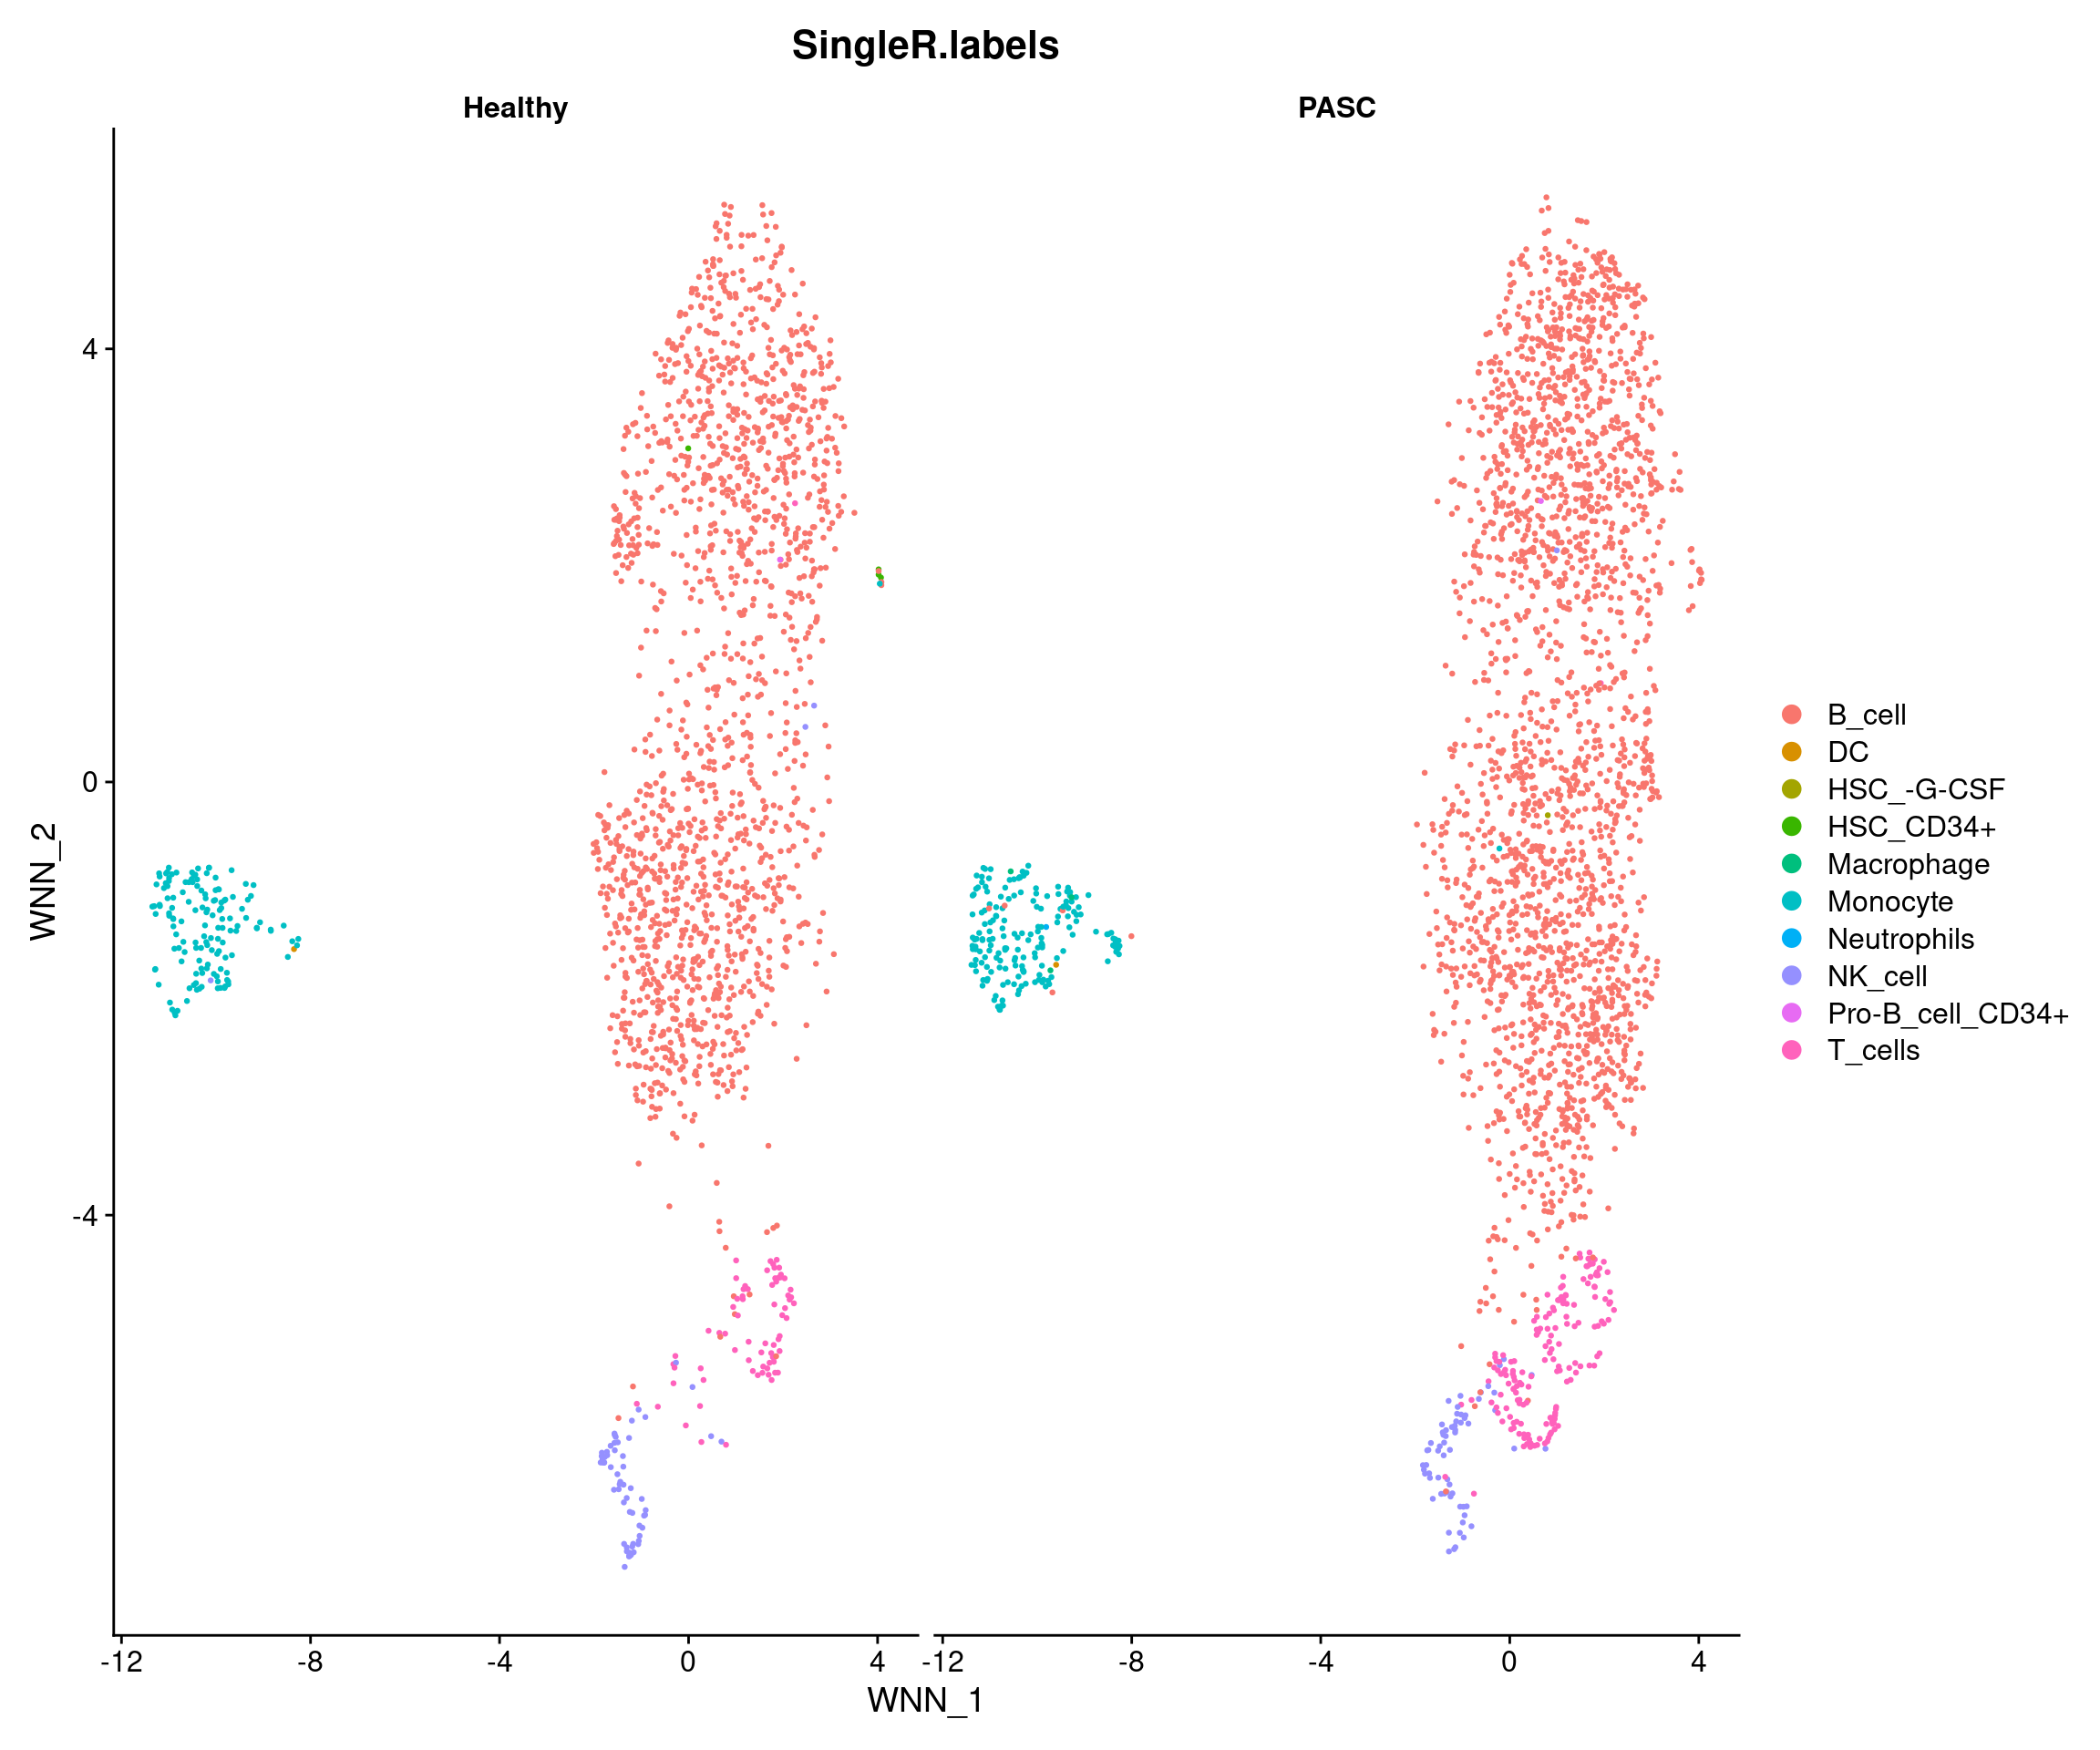
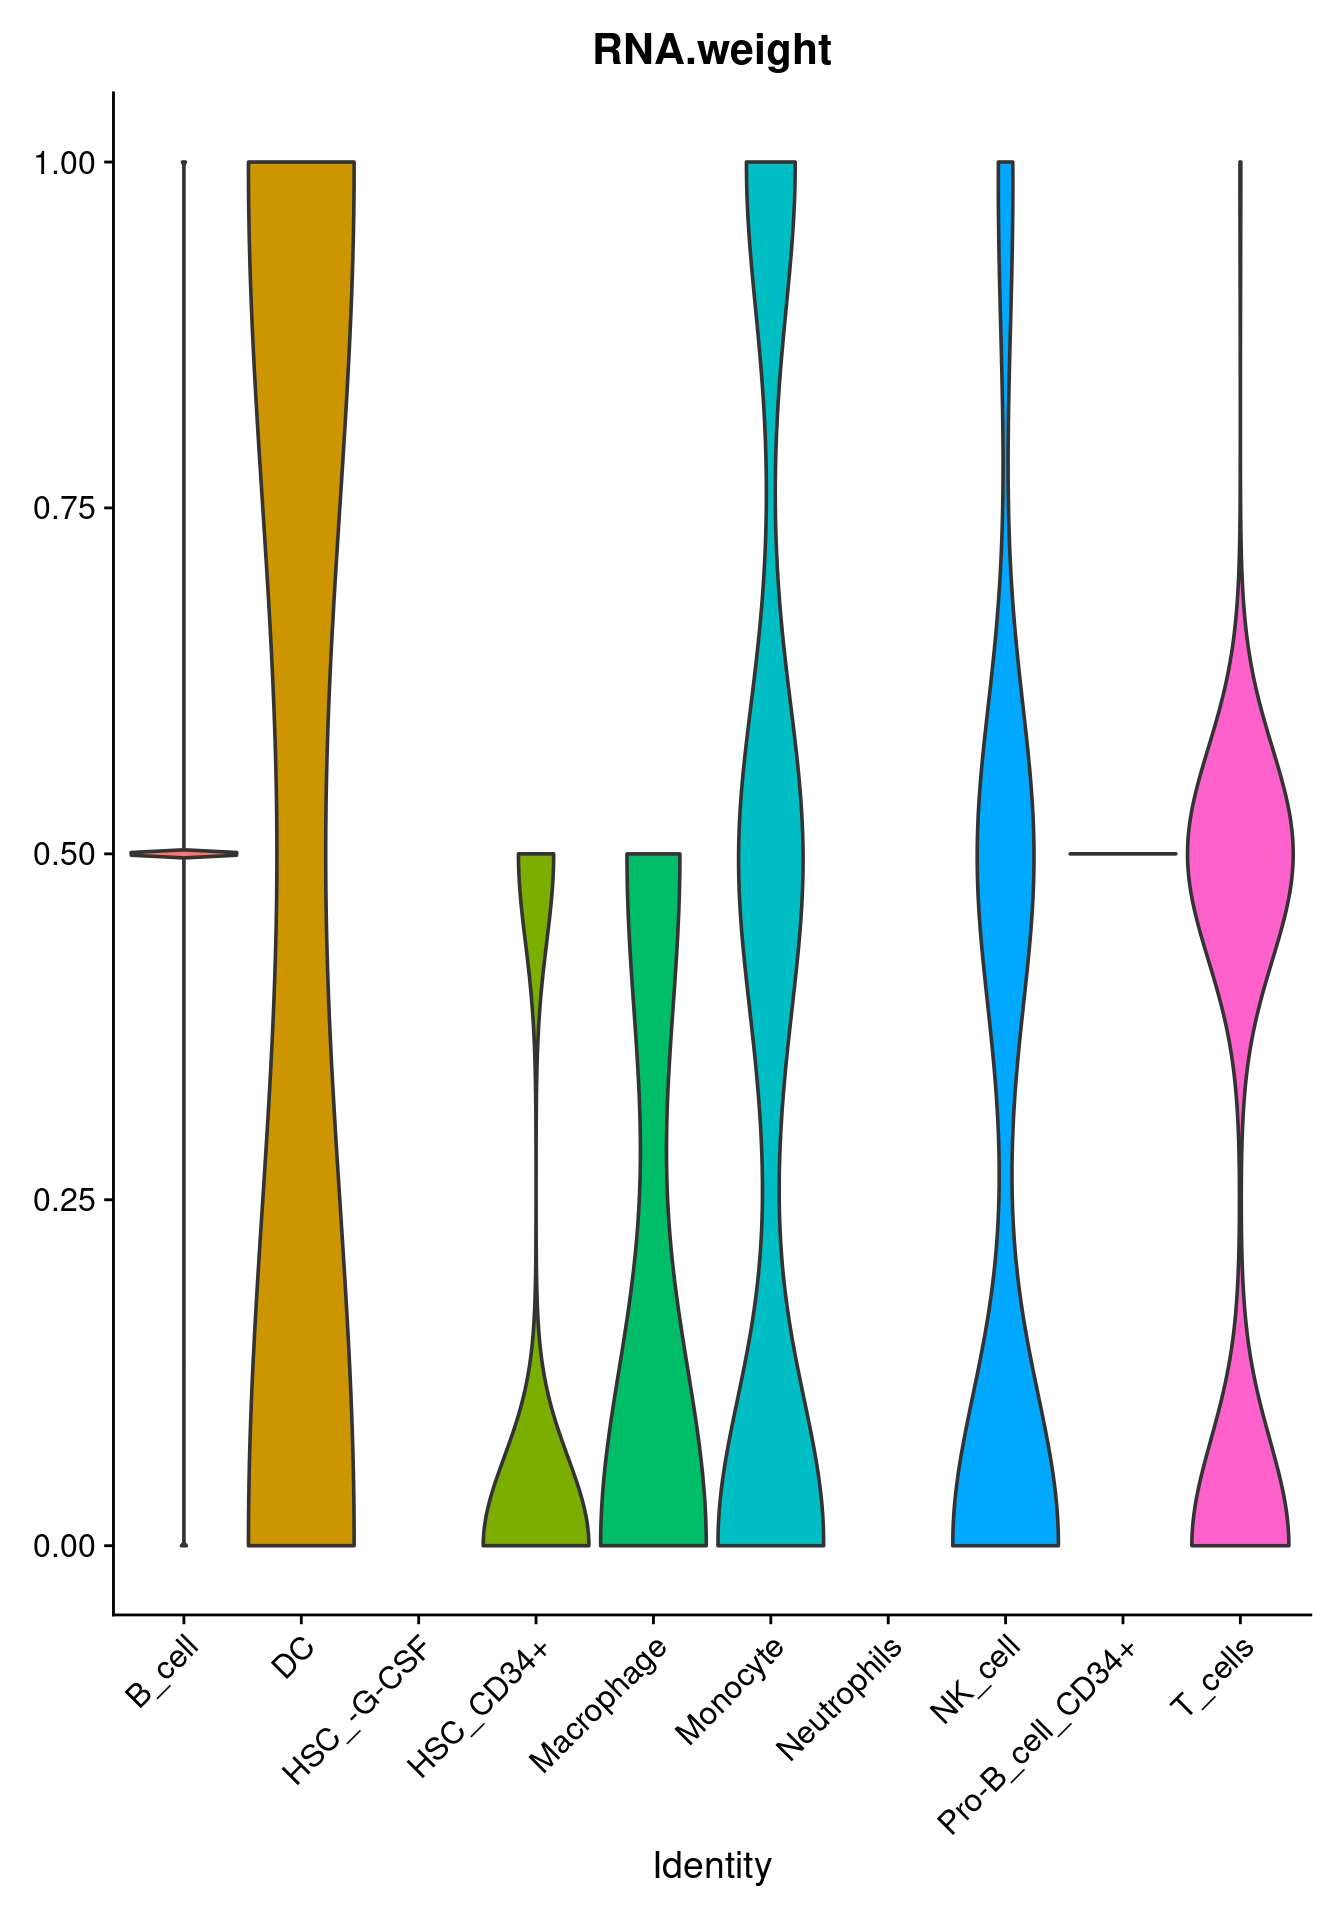
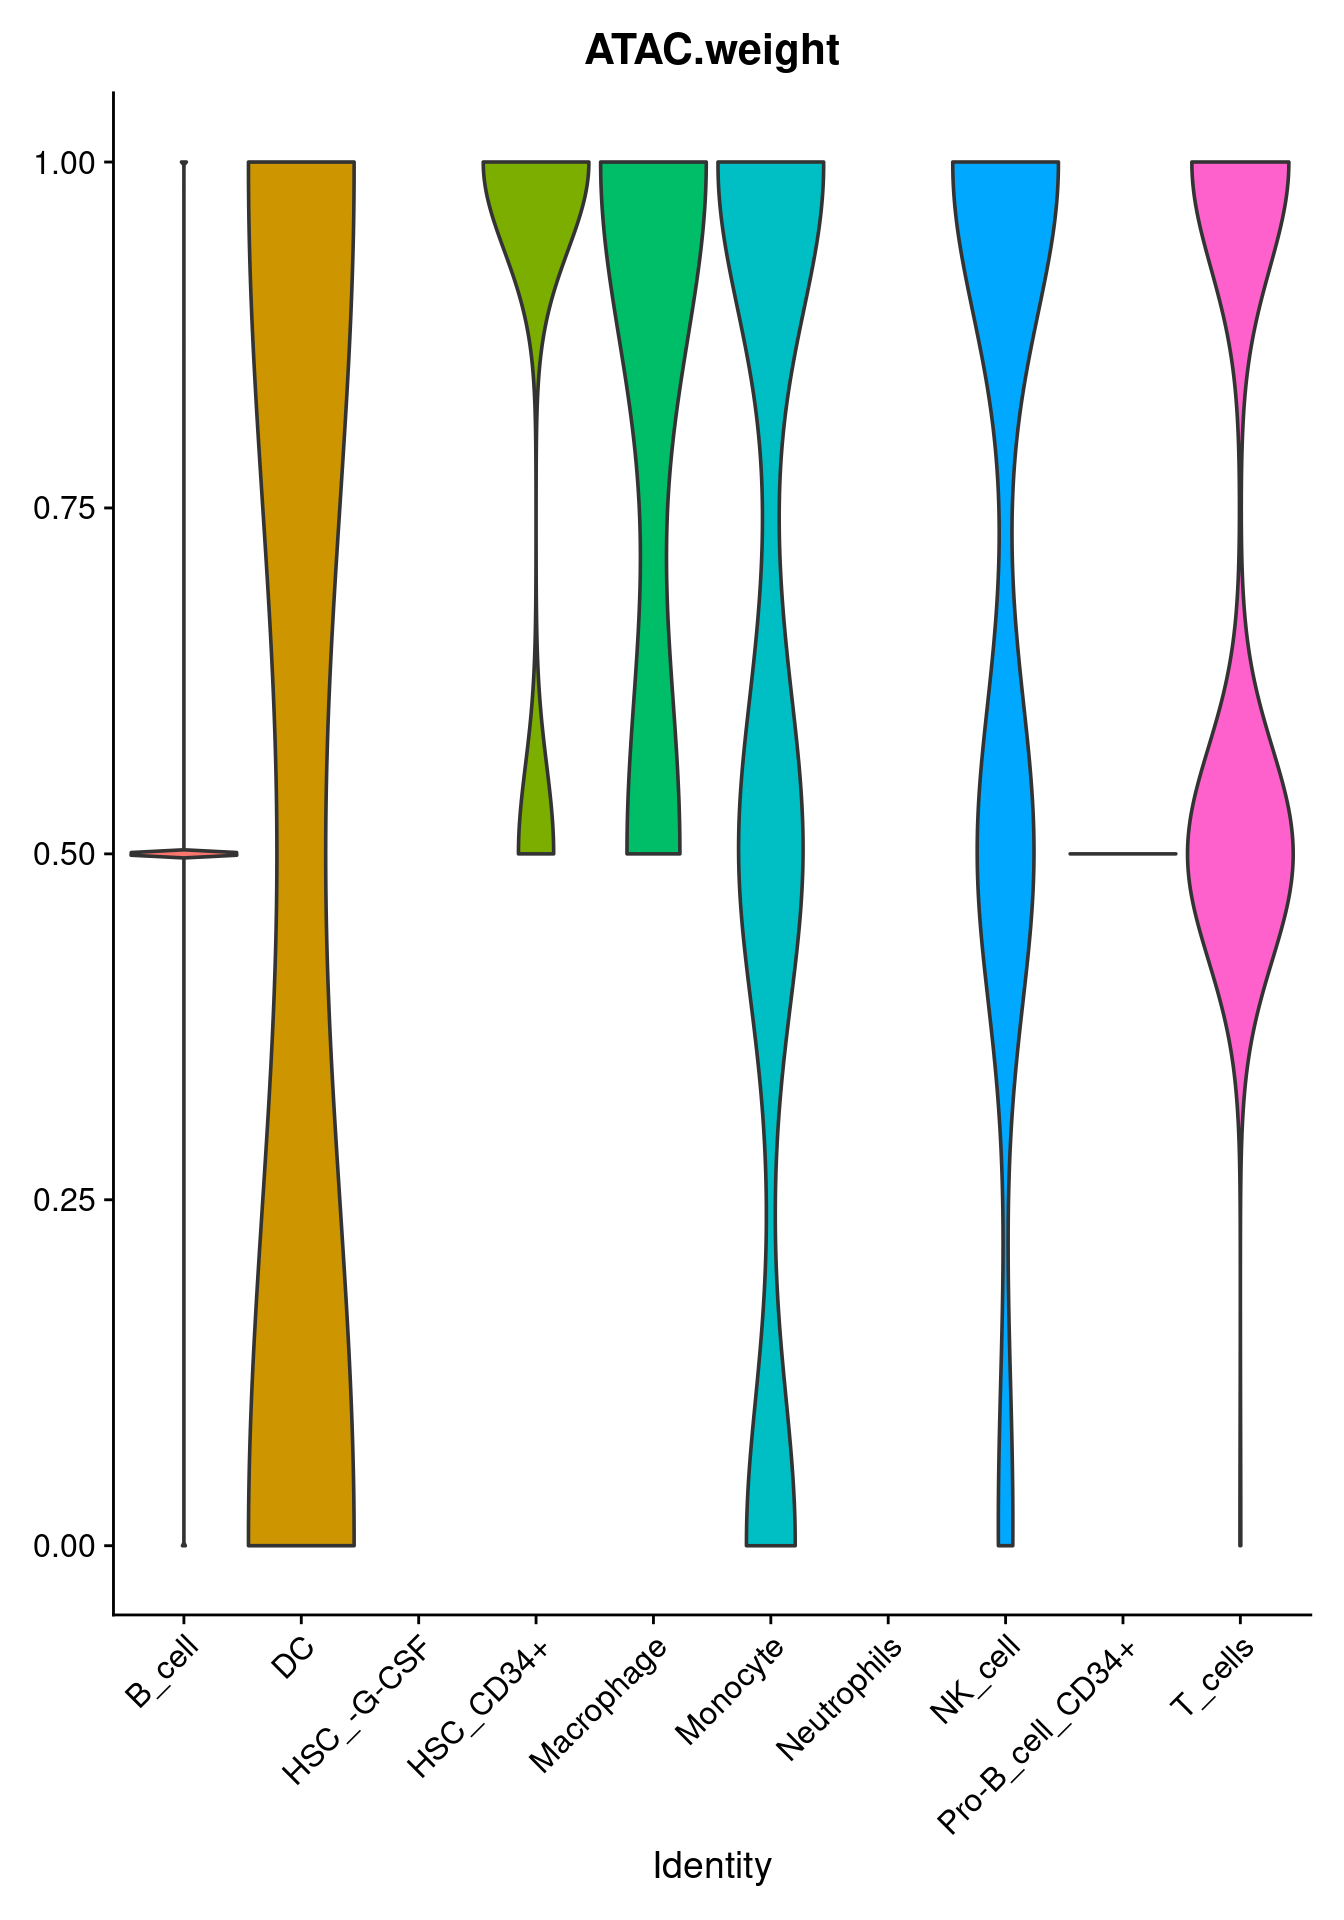
18.4 Modality weights
The RNA and ATAC weights per cell reflect how much each modality contributes to defining each cell’s neighbourhood. Cells where one modality dominates (weight close to 1) may have poor quality in the other modality.
18.5 Clustree — WNN resolution sweep
clustree(combined, prefix = 'wsnn_res.', show_axis = TRUE) +
  theme(legend.key.size = unit(0.20, 'cm'))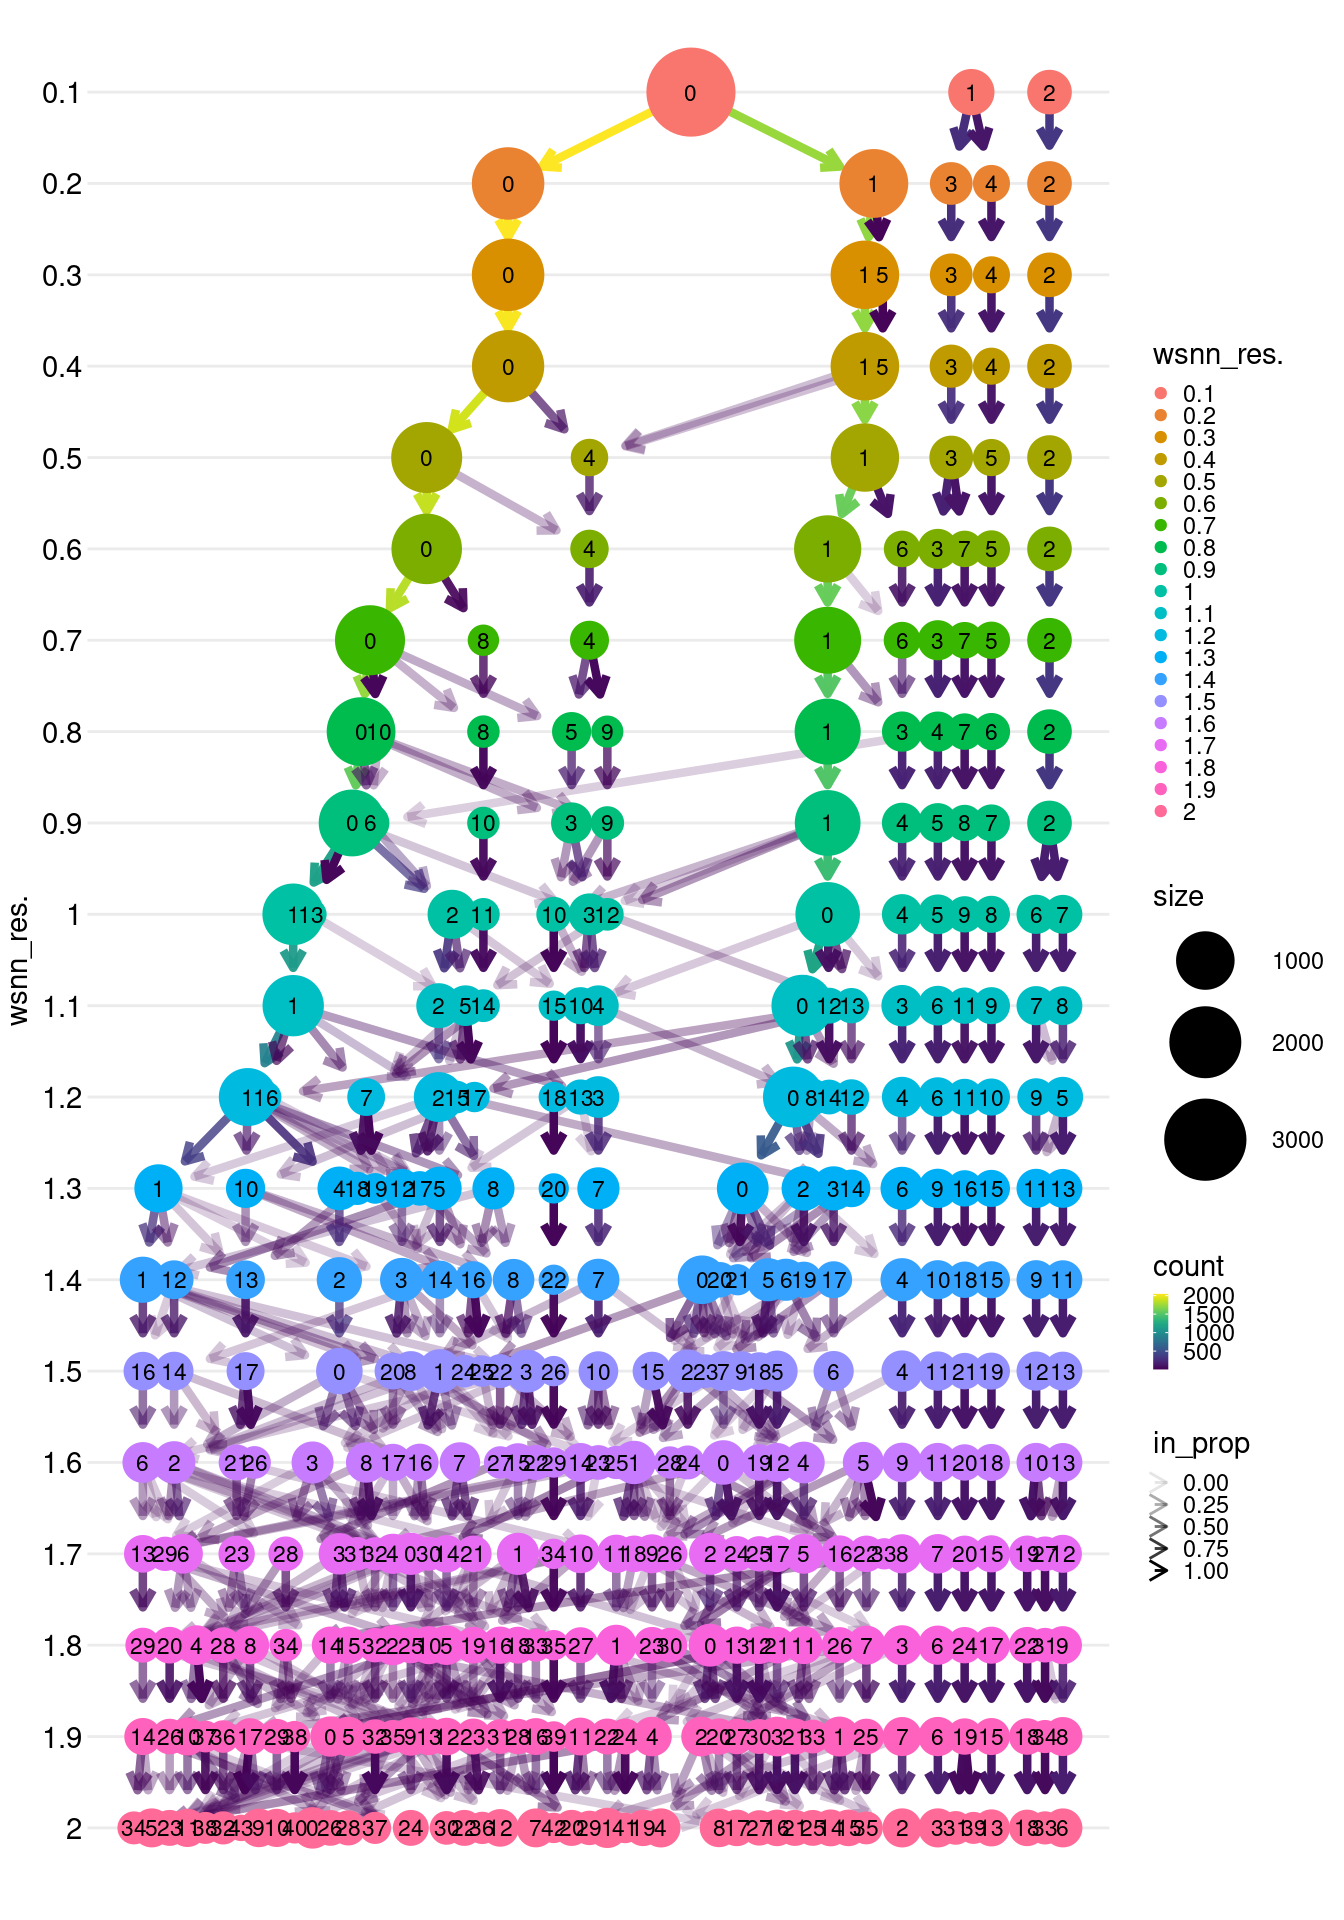
SaveSeuratRds(combined, "data/seurat_object_cross_modal_integration.rds")