10 RNA Processing
10.1 Normalisation and variable feature selection
Normalise the RNA assay using log-normalisation and identify the top 3000 most variable genes. Cell cycle scores (S phase and G2/M phase) are assigned to each cell using the canonical marker gene lists from Seurat. These scores are used later to assess whether cell cycle phase is a confounding source of variation in the data.
DefaultAssay(combined) <- "RNA"

combined<-NormalizeData(combined) %>%
  FindVariableFeatures(nfeatures = 3000) %>%
  CellCycleScoring(s.features = cc.genes.updated.2019$s.genes,
                   g2m.features = cc.genes.updated.2019$g2m.genes)


combined<-  FindVariableFeatures(combined,nfeatures = 3000)
combined <- SCTransform(combined)

combined <- ScaleData(combined)
combined <- RunPCA(combined, npcs = 50)
combined <- RunUMAP(combined, dims = 1:20,
                   reduction.name = "umap.rna",
                   reduction.key  = "UMAPRNA_")


DefaultAssay(combined)
#> [1] "SCT"
10.2 PCA diagnostics
Visualise the top gene loadings for the first two principal components, the PCA plot, heatmaps for the top six PCs, and an elbow plot to guide the choice of how many PCs to retain for downstream neighbour finding.
VizDimLoadings(combined, dims = 1:2, reduction = "pca")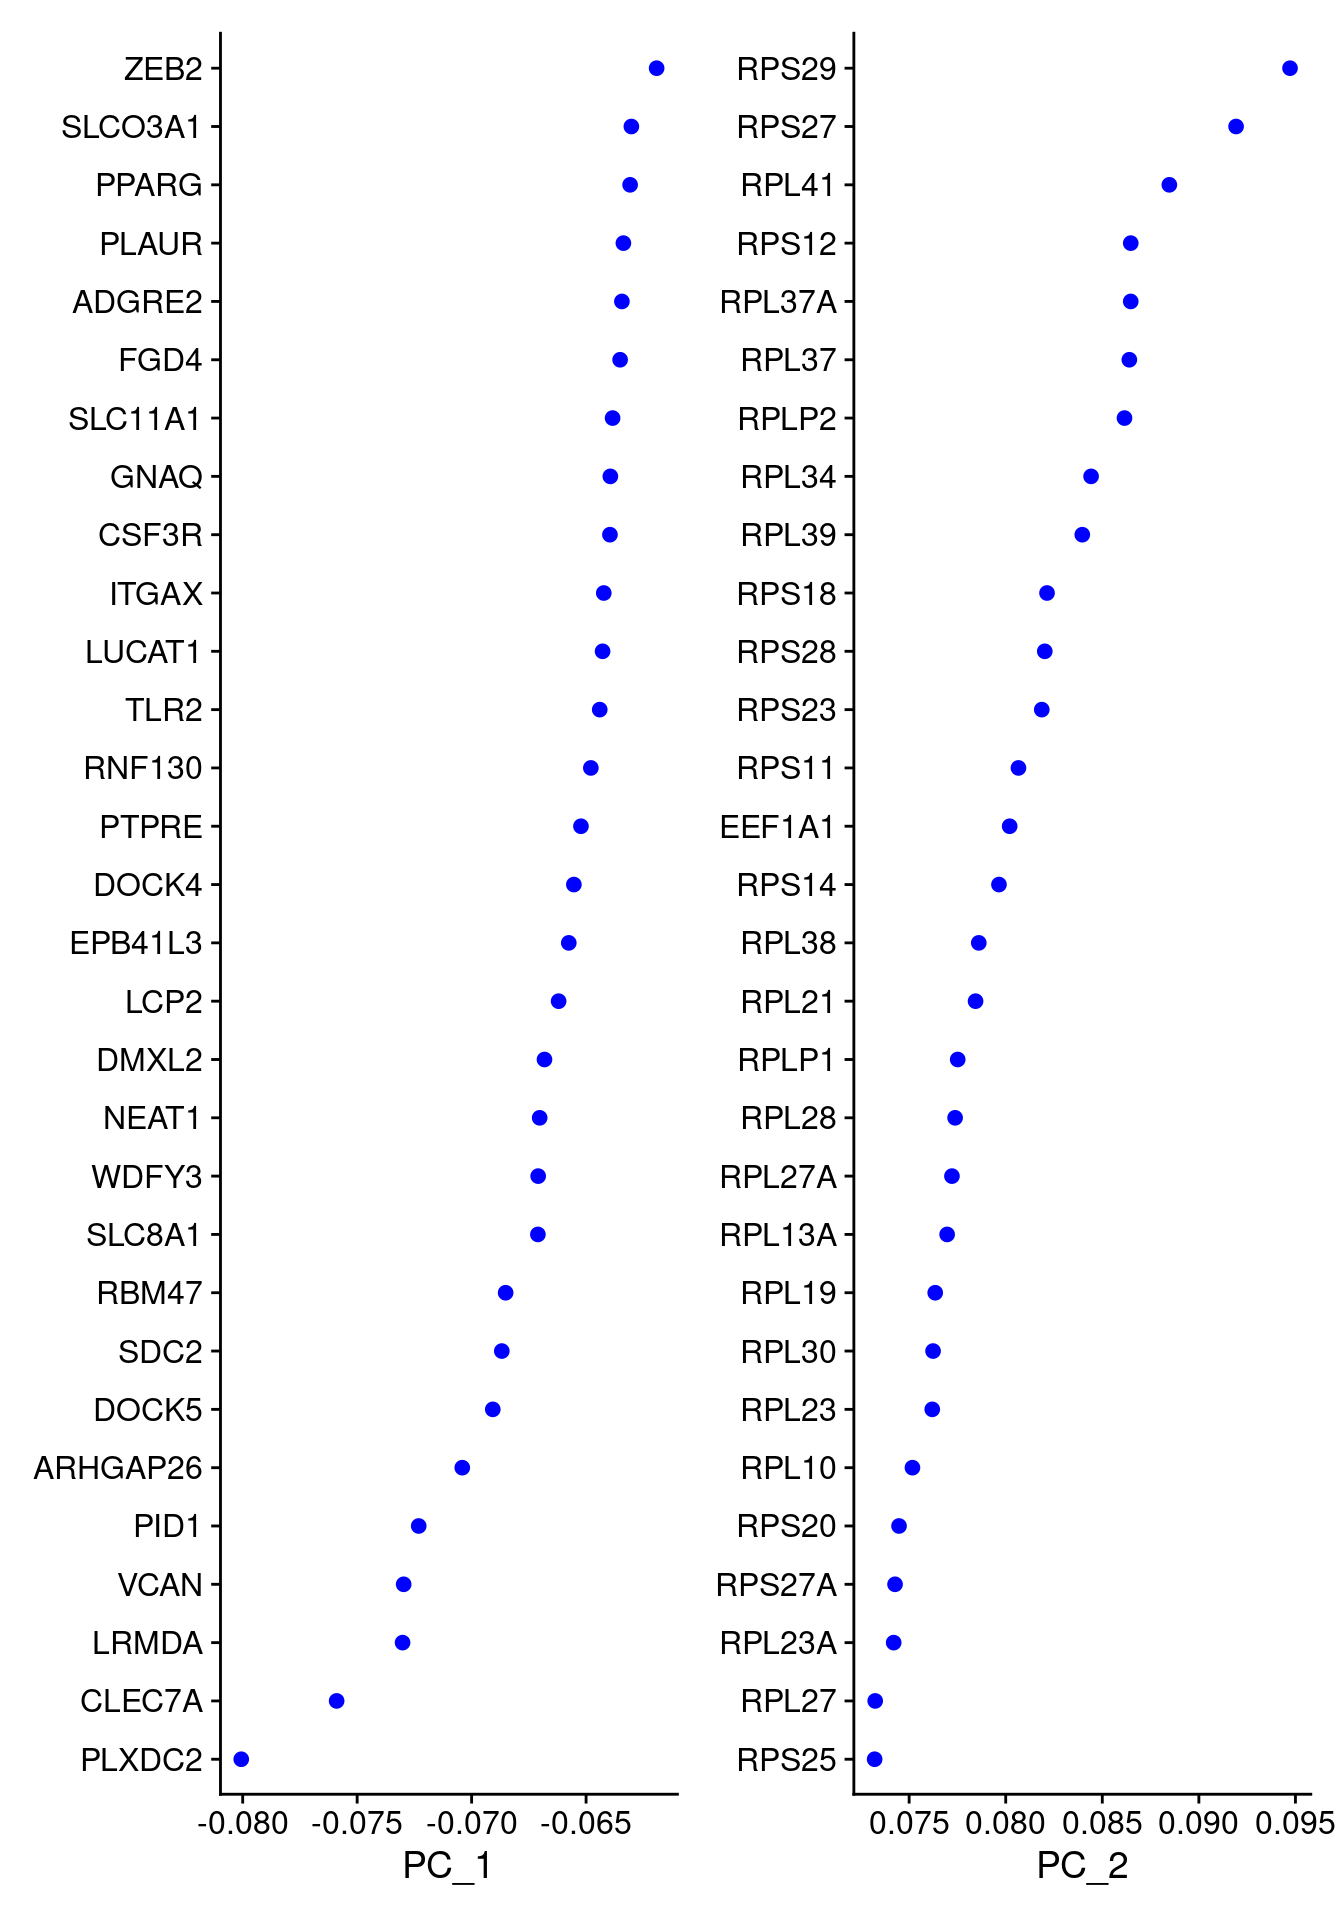
DimPlot(combined, reduction = "pca")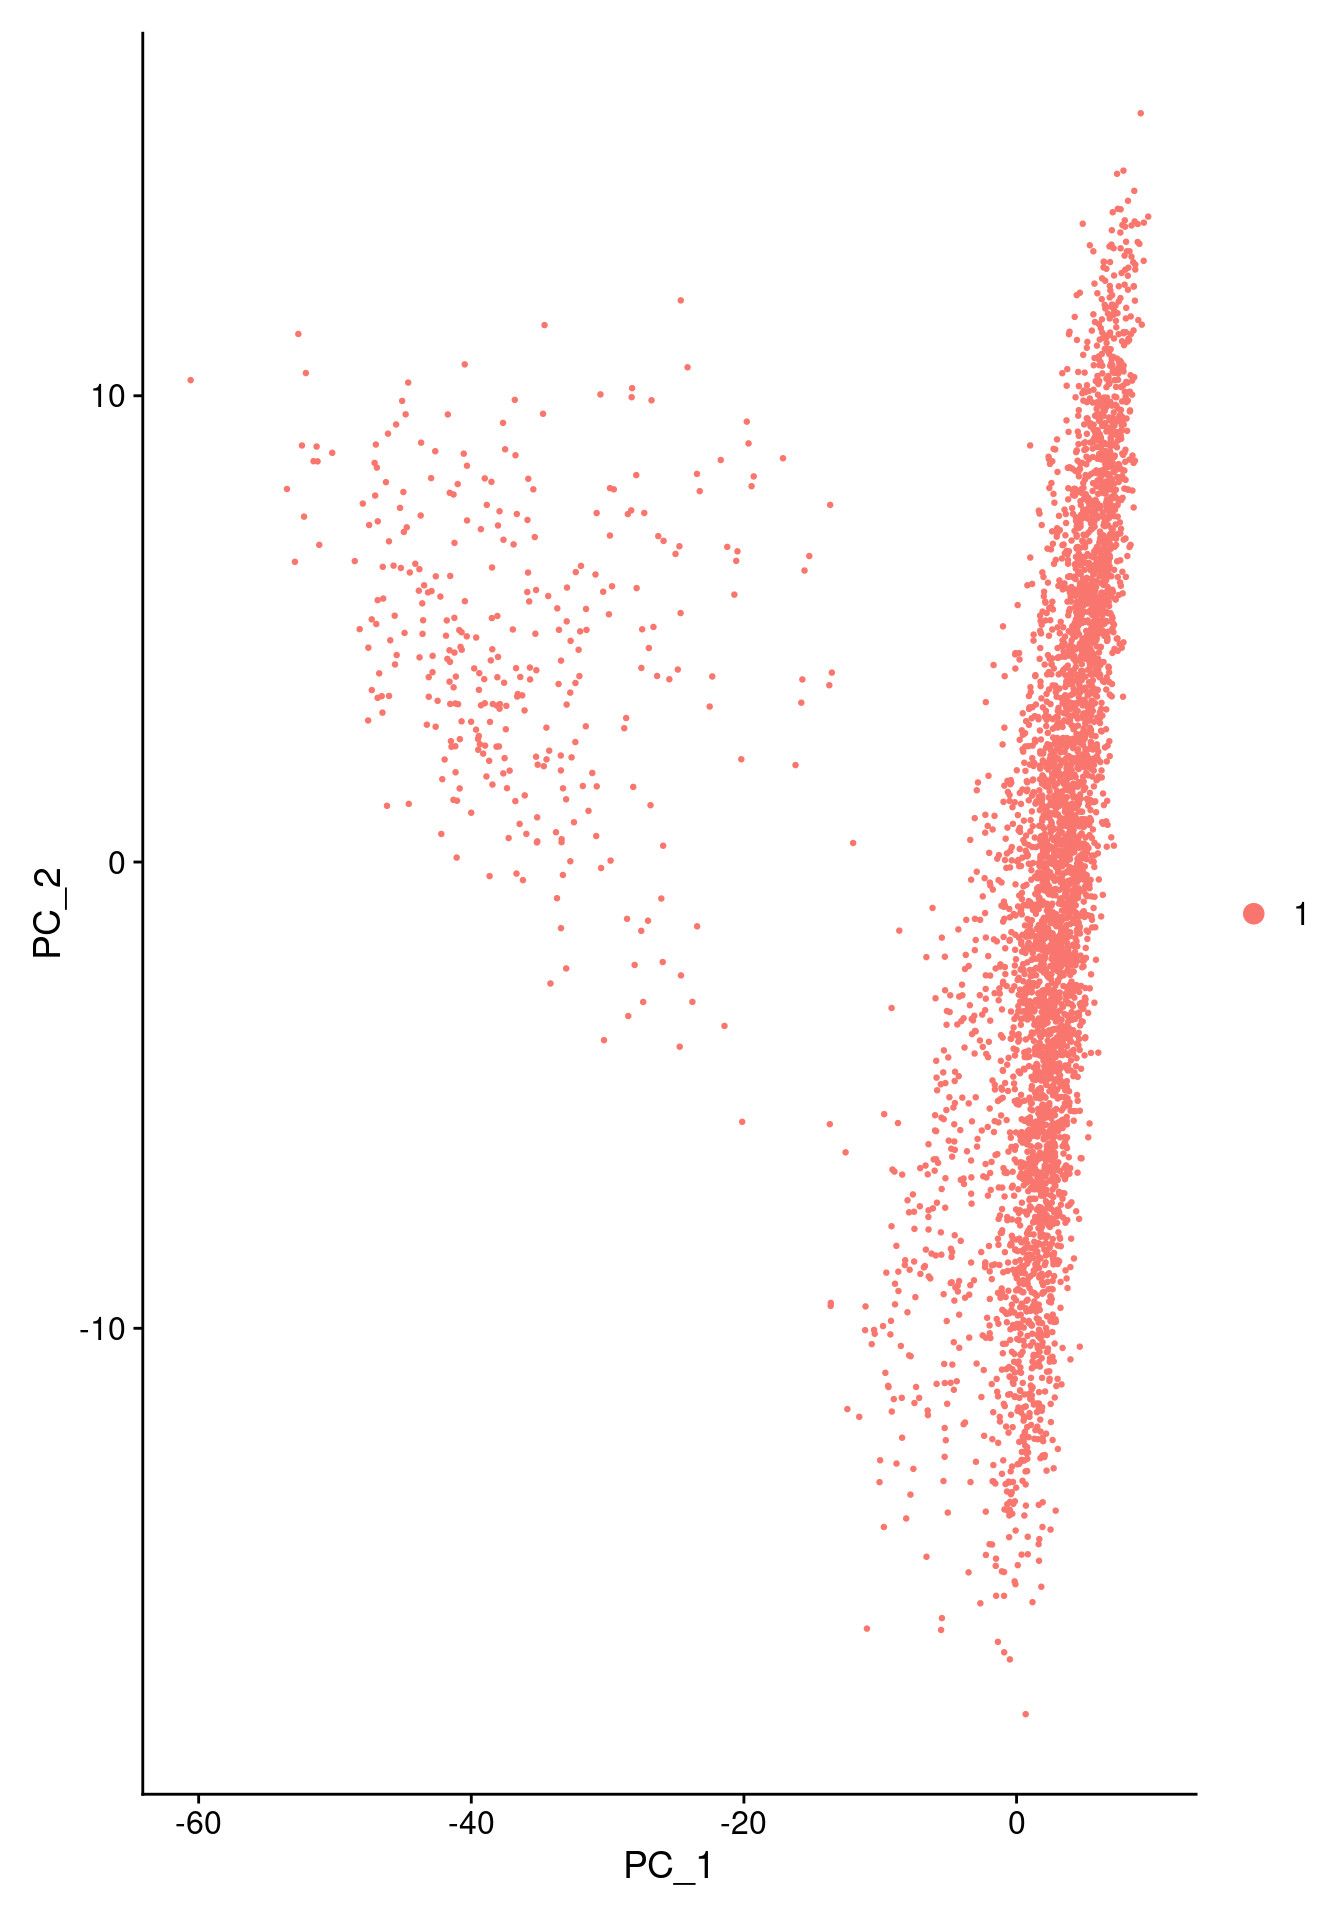
DimHeatmap(combined, dims = c(1:6), cells = 500, balanced = TRUE)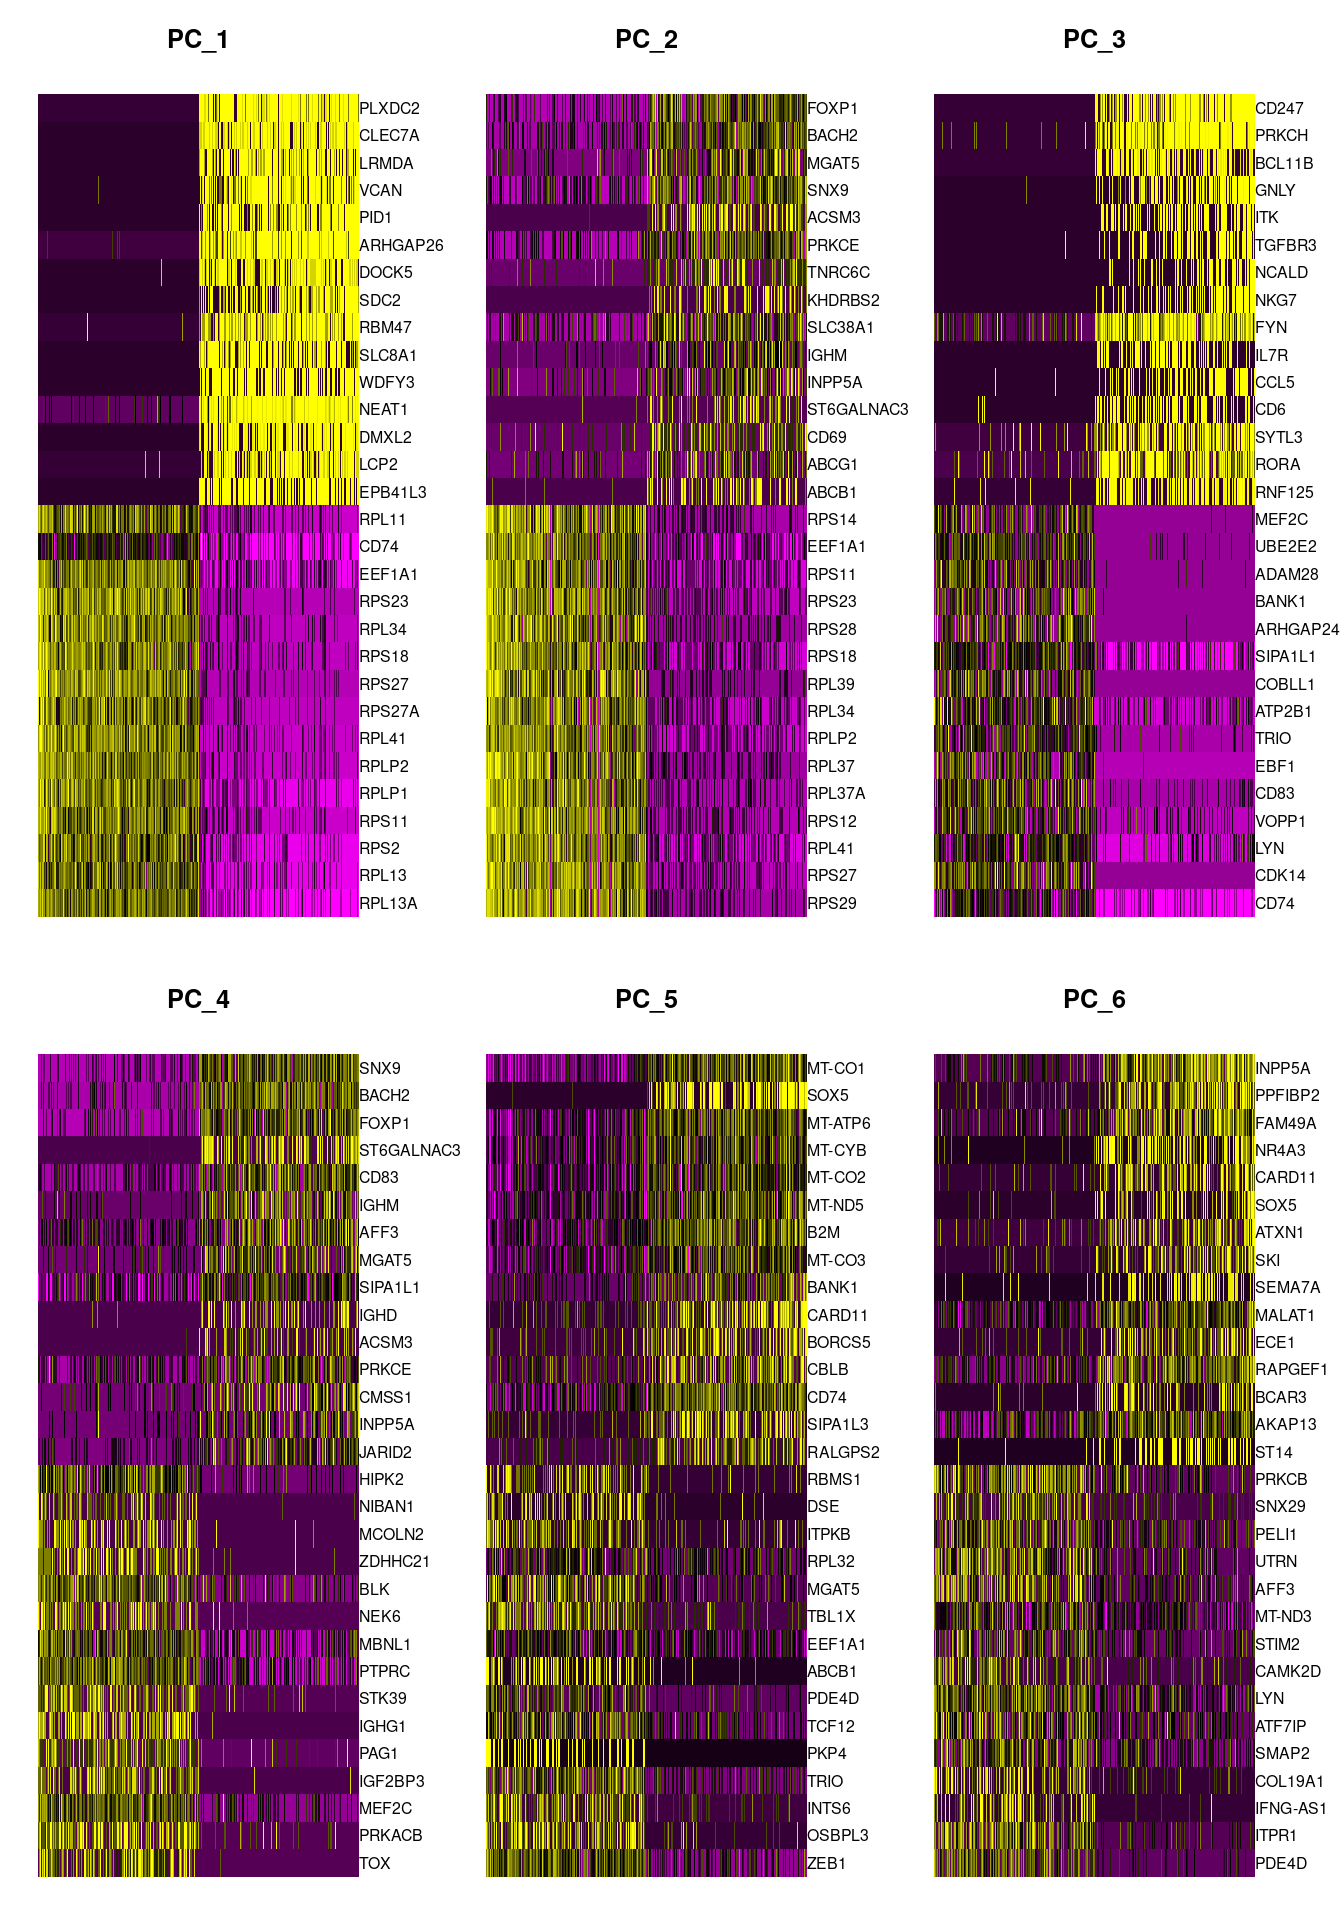
ElbowPlot(combined, ndims = 50, reduction = "pca")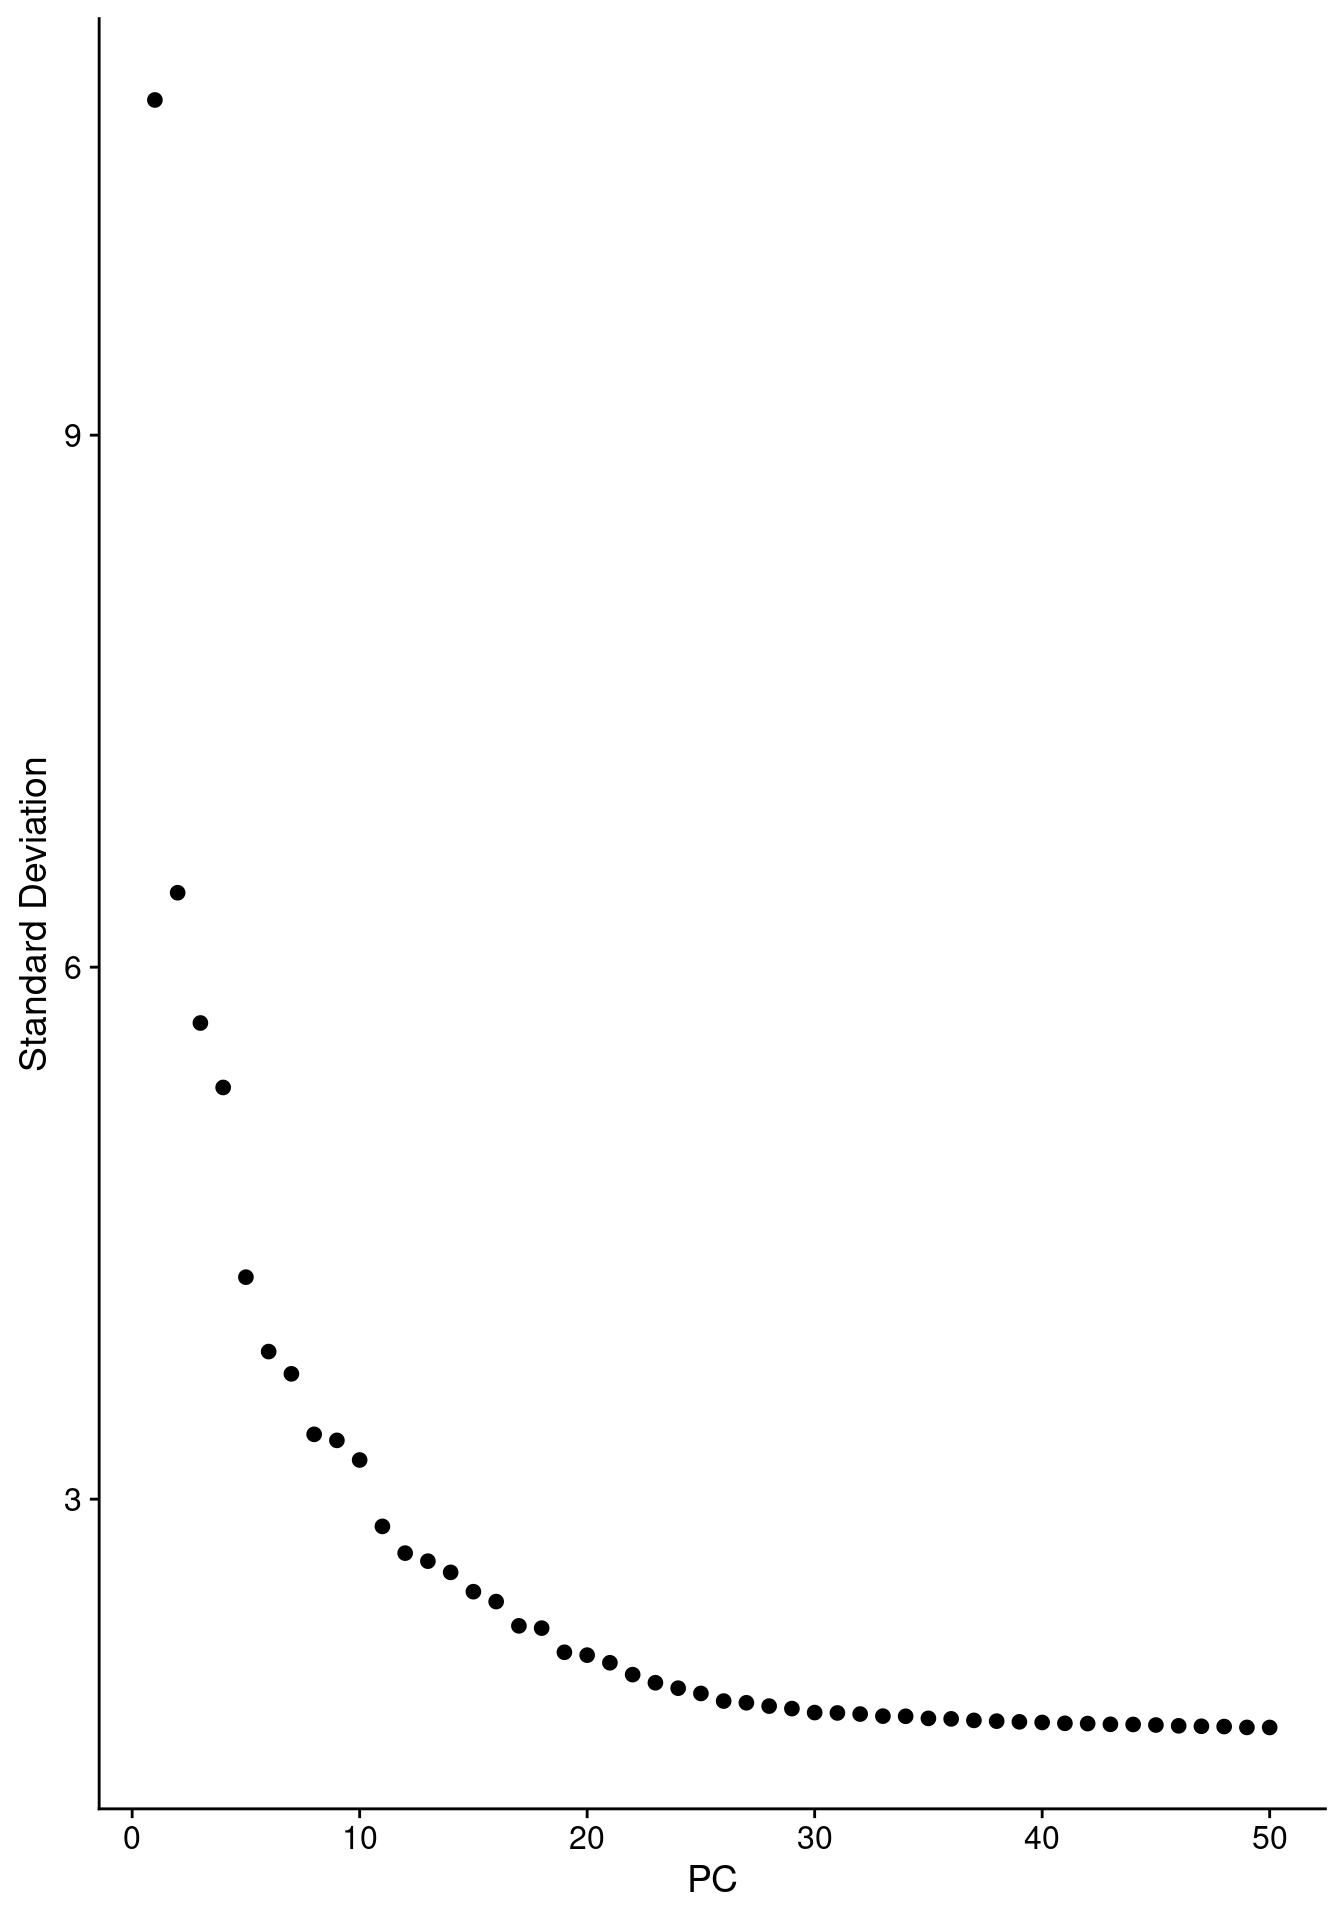
10.3 Initial clustering
Find neighbours using the first 15 PCs and sweep a range of resolutions from 0.1 to 2.0. The clustree section below uses these resolution sweeps to guide the final choice of resolution.
options(future.globals.maxSize = Inf)
combined <- FindNeighbors(combined, dims = 1:15)

resolution <- 2
combined   <- FindClusters(combined,
                           reduction.type = "umap",
                           resolution     = seq(0.1, resolution, 0.1),
                           dims.use       = 1:15,
                           save.SNN       = TRUE)
10.4 Naive UMAP — by sample and donor
DimPlot(combined, group.by = "sample", reduction = "umap.rna")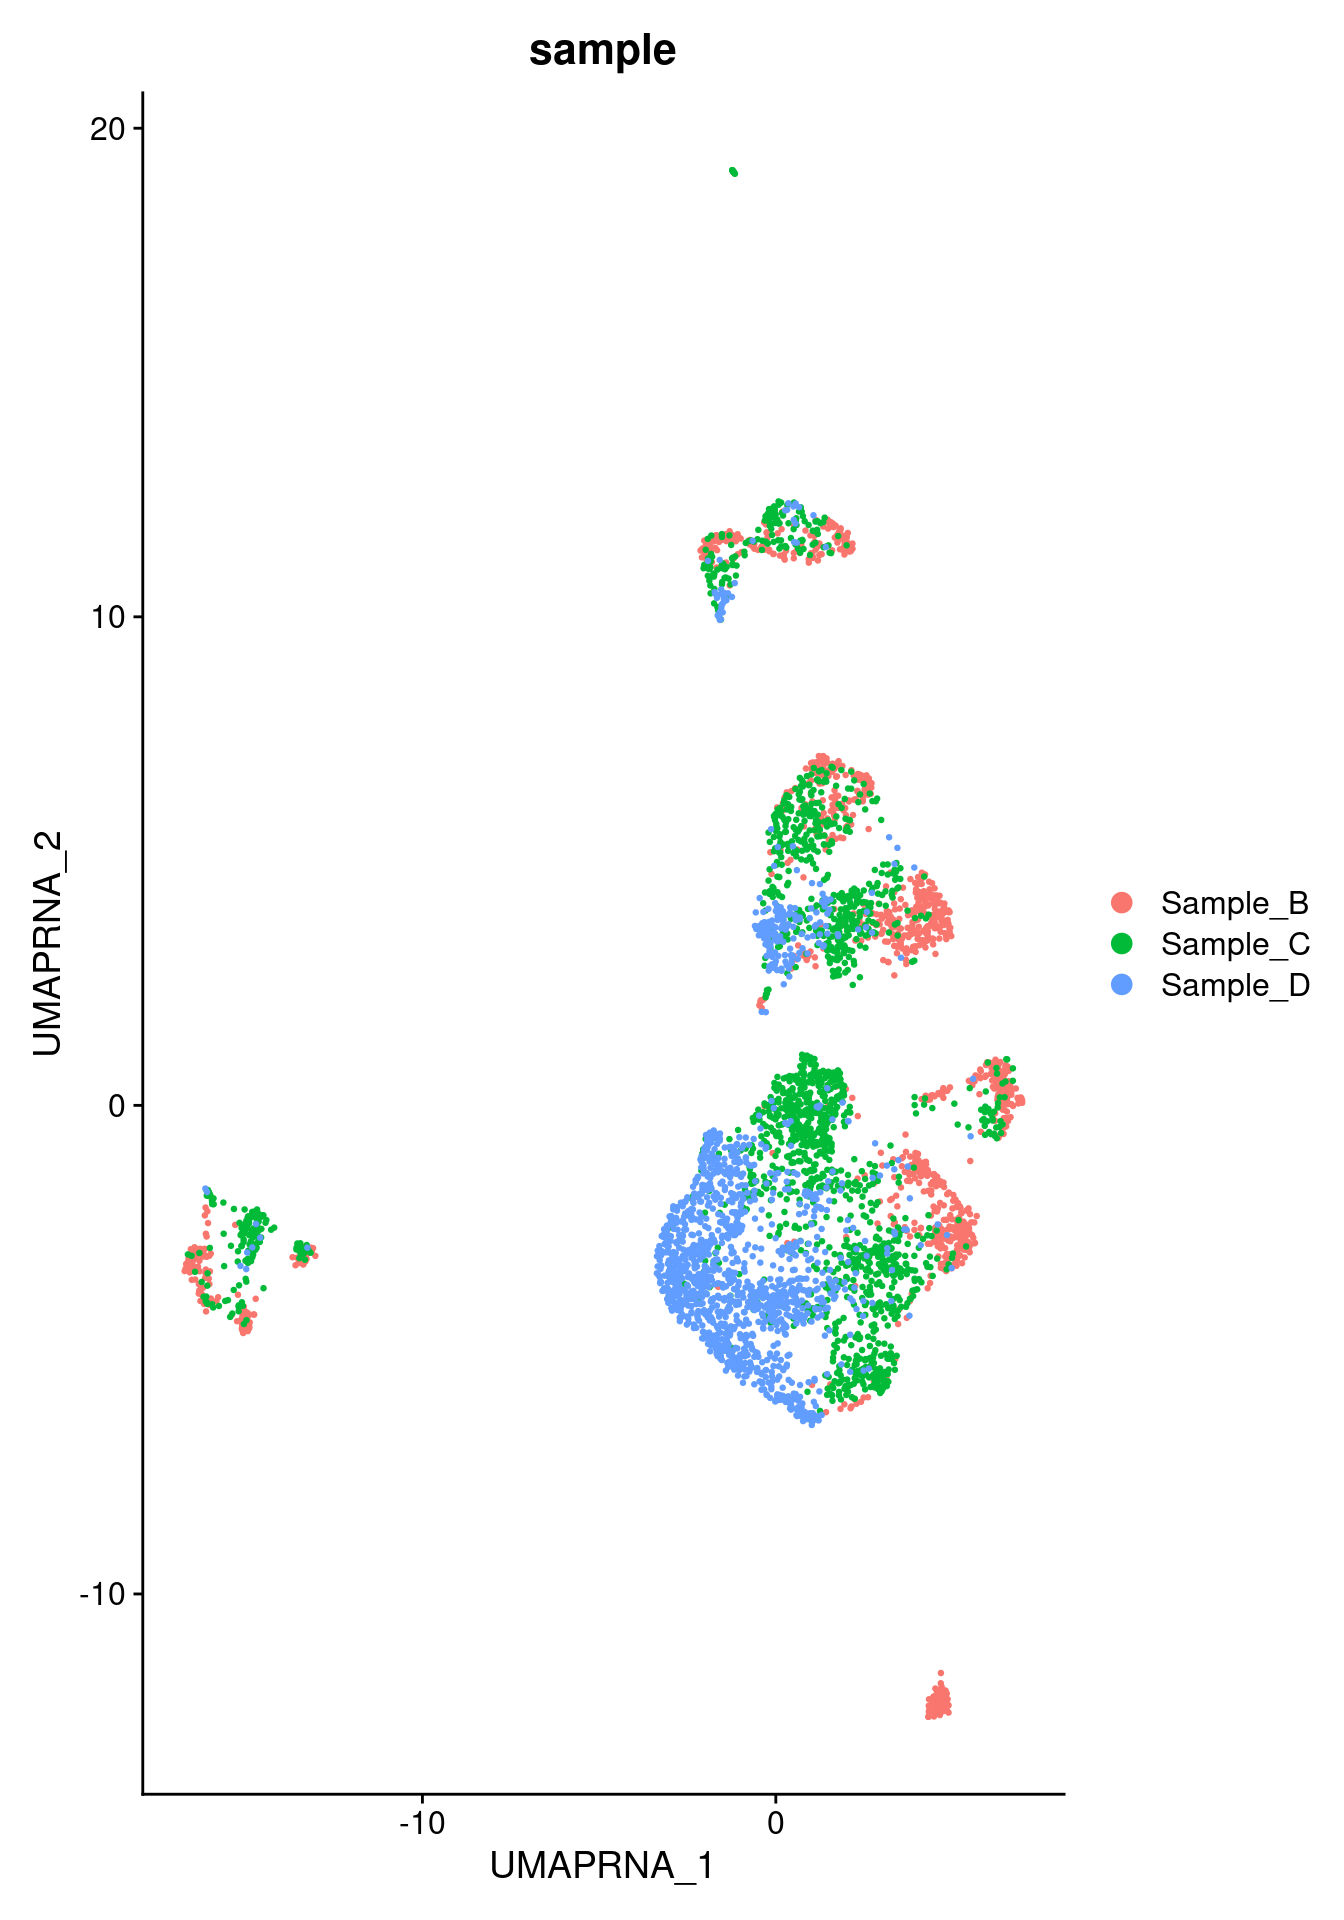
DimPlot(combined, group.by = "sample_donor", reduction = "umap.rna")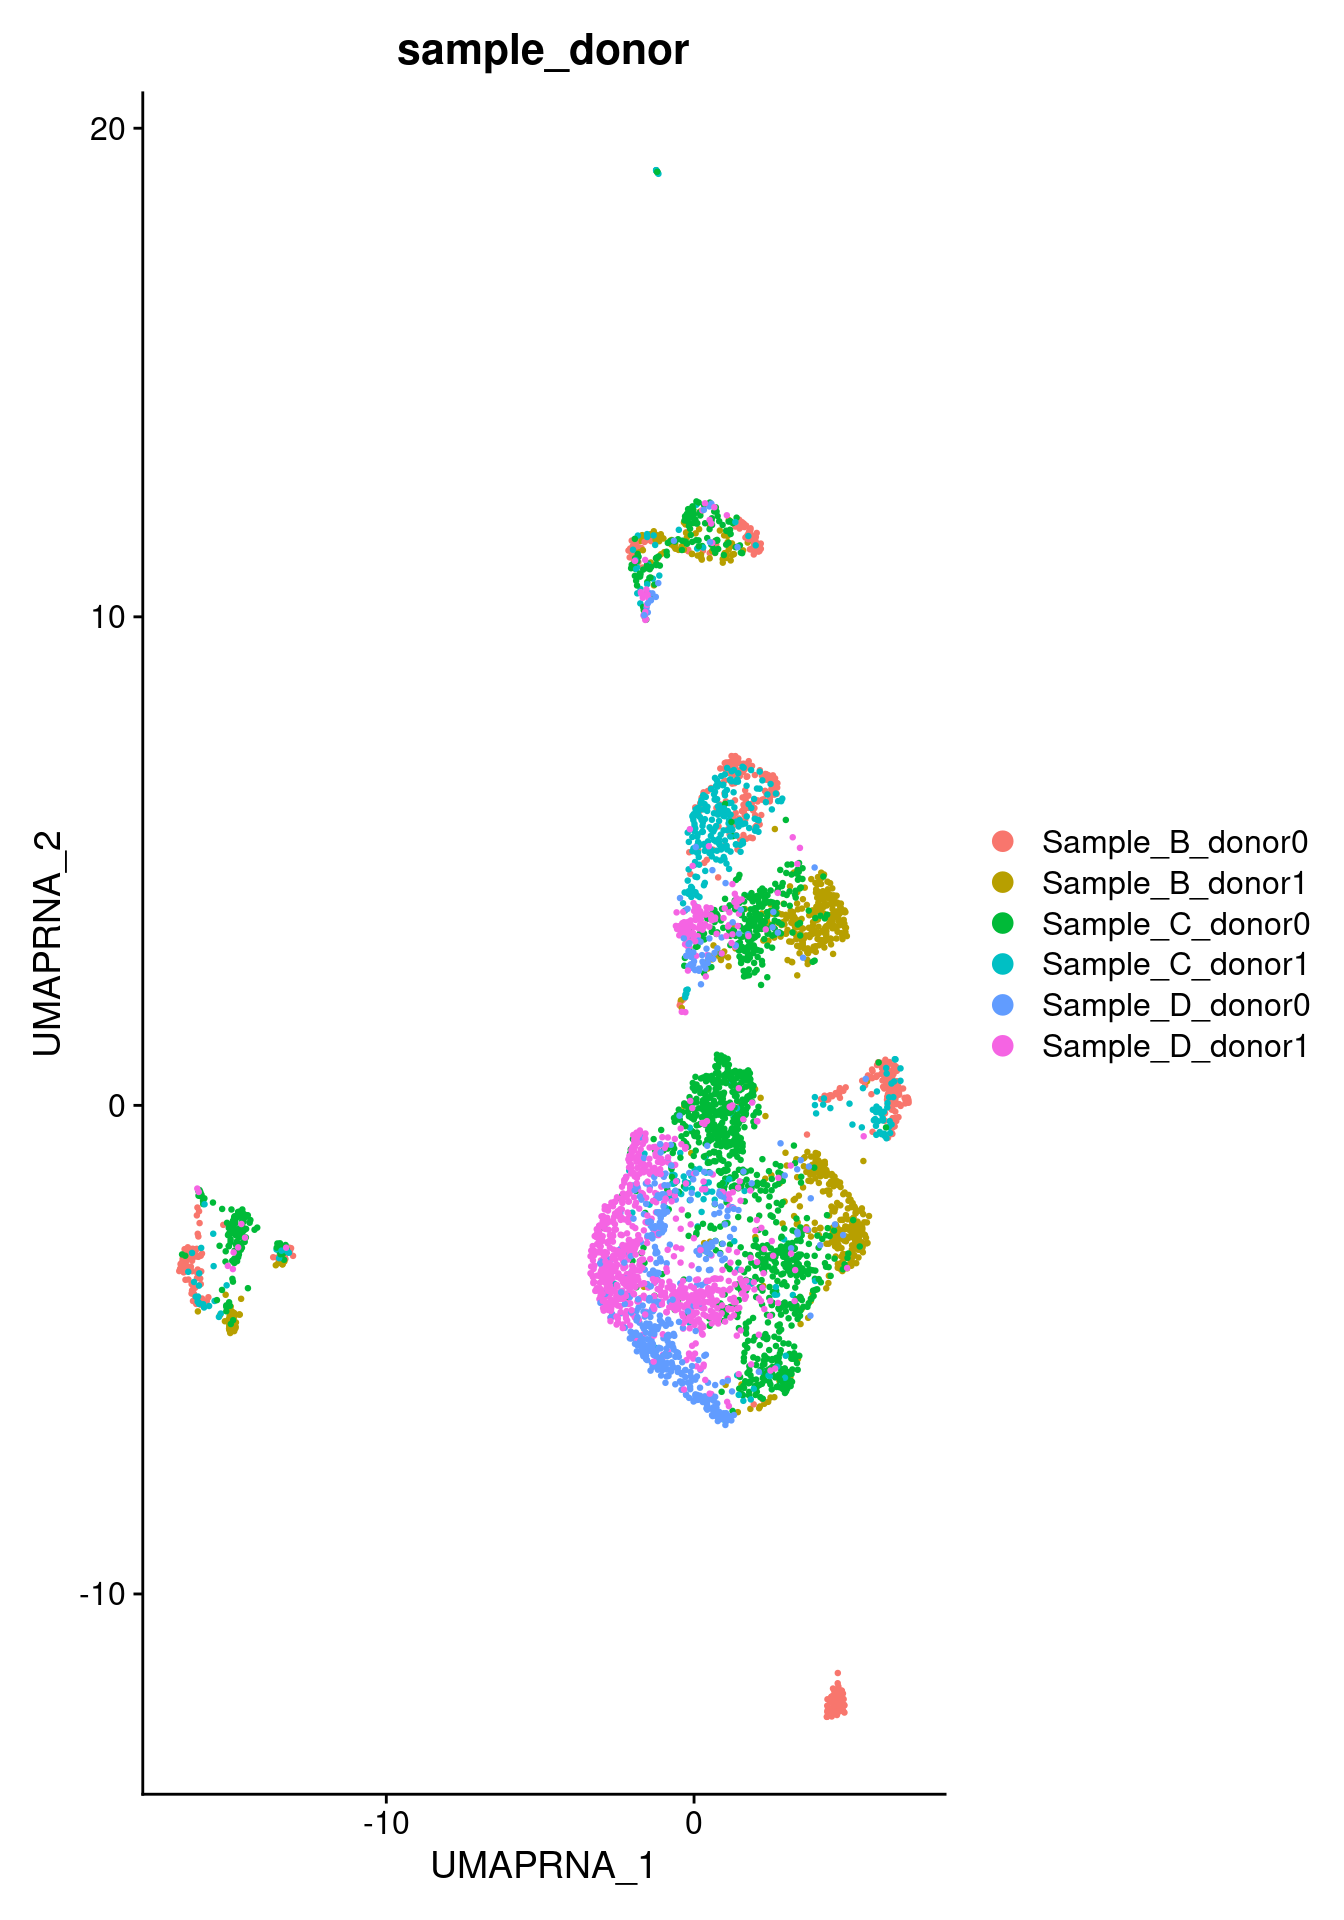
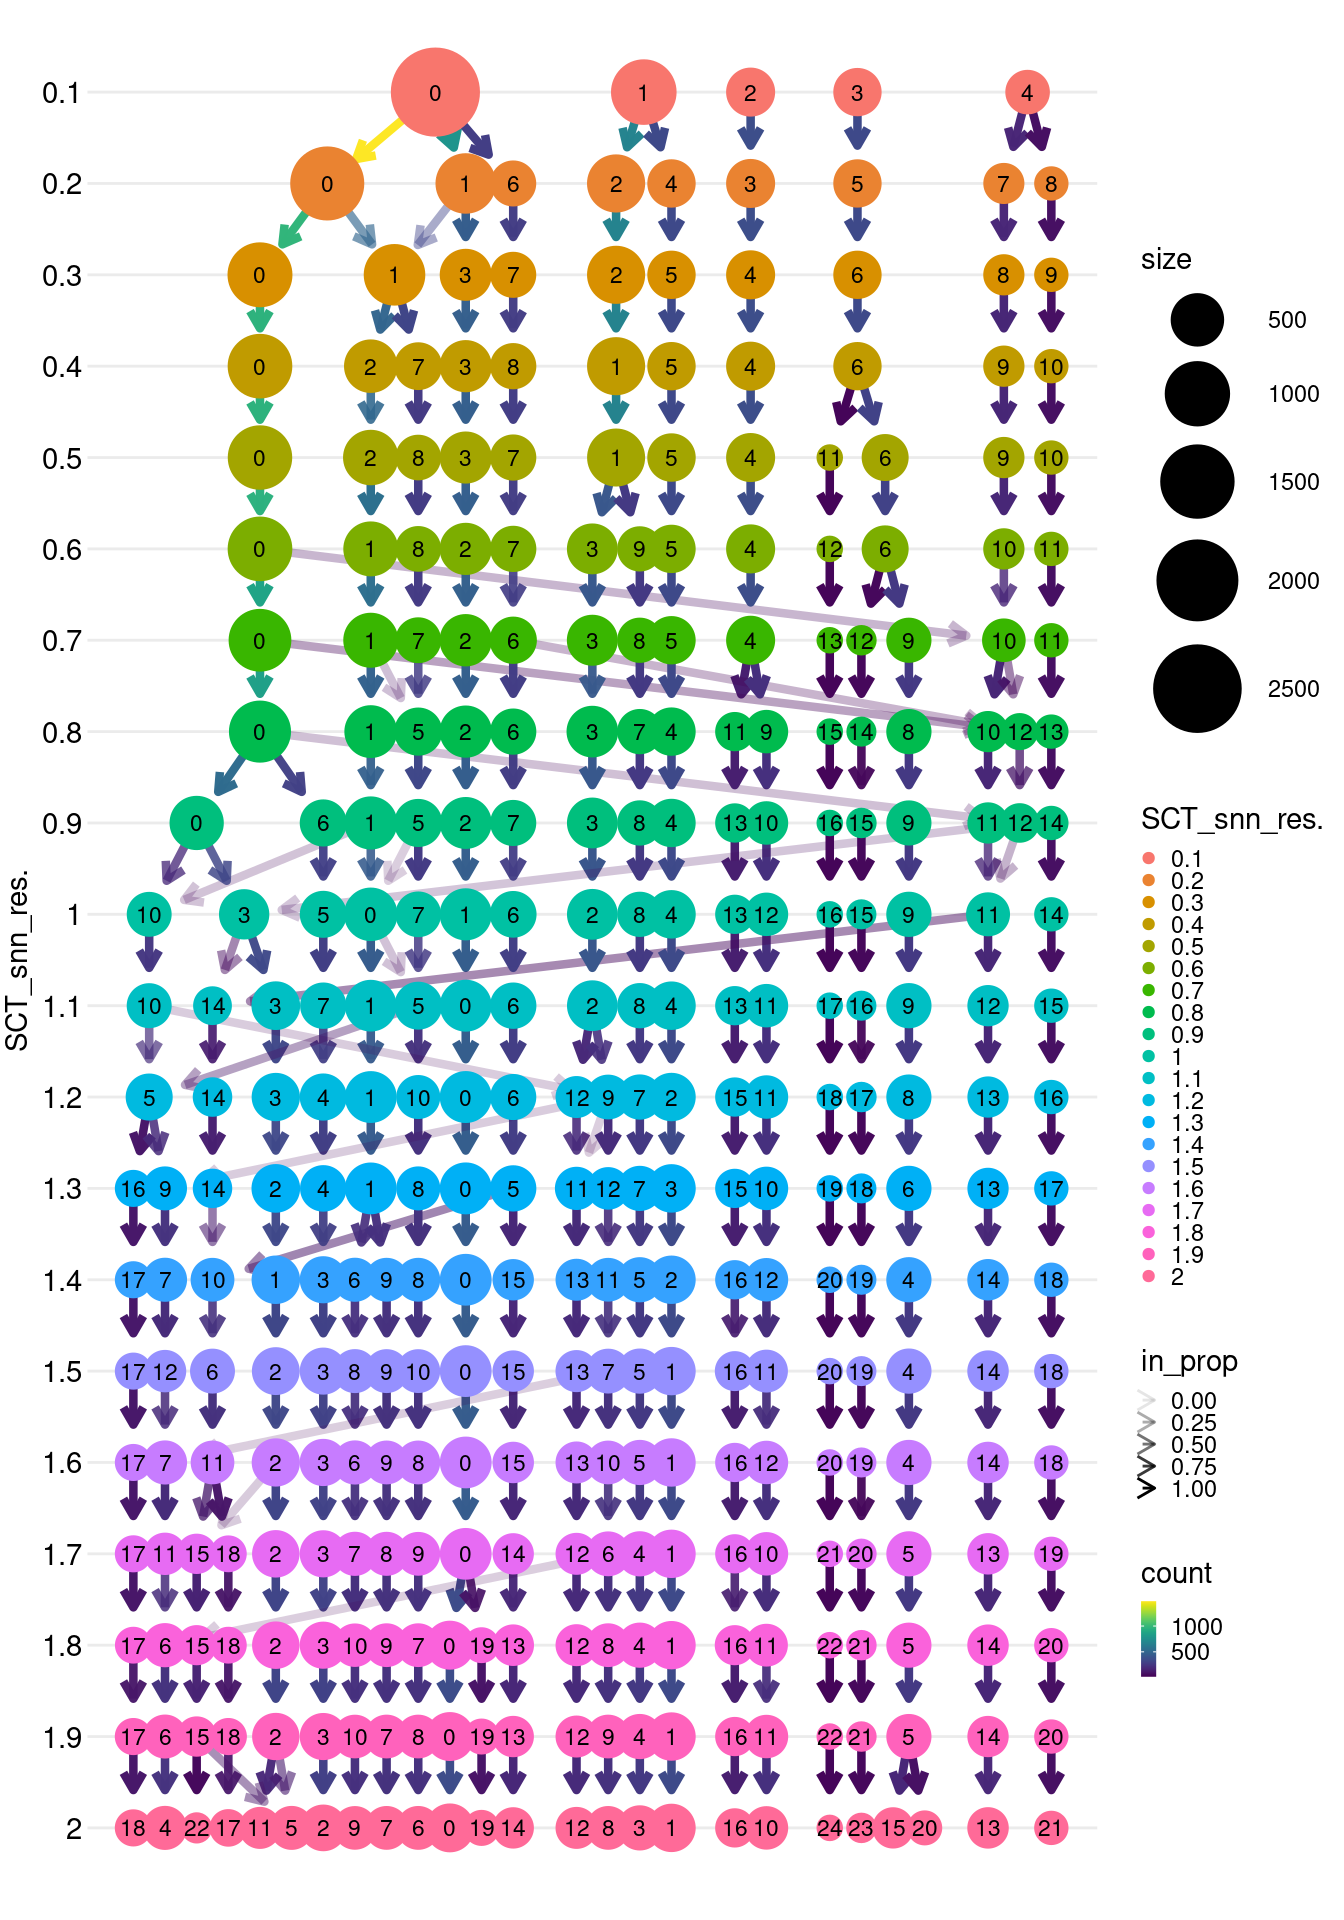
10.5 Clustree — RNA resolution sweep
The clustree plot traces how cluster membership changes across resolutions. Stable clusters that persist across several resolutions and avoid extensive branching are preferred. Use this to select a resolution for final annotation.
clustree(combined, prefix = 'SCT_snn_res.', show_axis = TRUE) +
  theme(legend.key.size = unit(0.20, 'cm'))